

Viewing the task-level DAG information
The DAG Info tab shows the Directed Acyclic Graph of the vertices against time. Each mapping and reducing task is a vertex.
The following image shows the DAG swimlane:
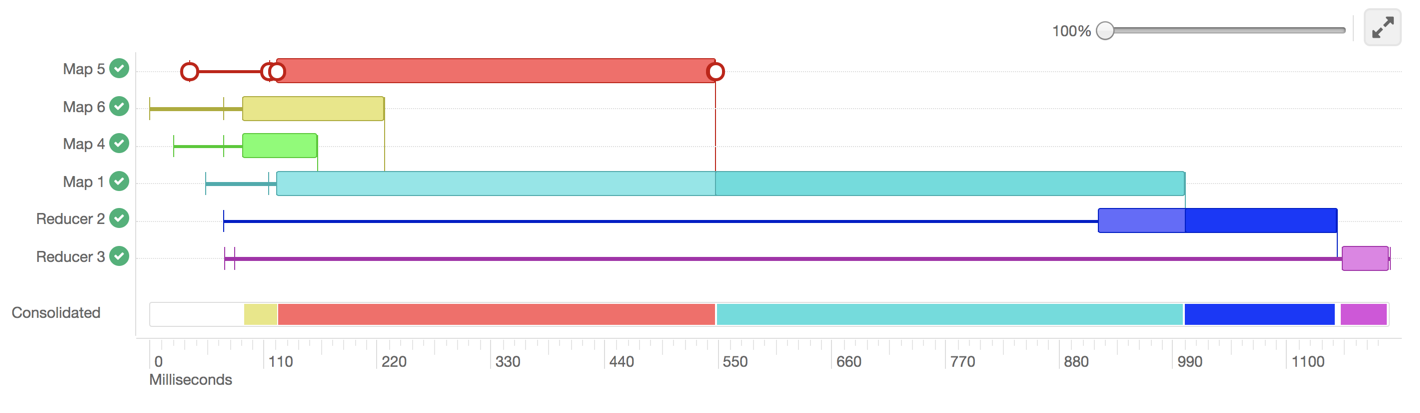
Each horizontal bar of the swimlane represents the total time taken by the vertex to complete. The vertical lines indicate the time when the vertex initialized, the time when the vertex started, the time when the first task started, the time when the last task completed, and the time when the vertex finished its execution. When you mouseover the vertical line, the bubble displays the stage of the vertex execution and provides a timestamp.
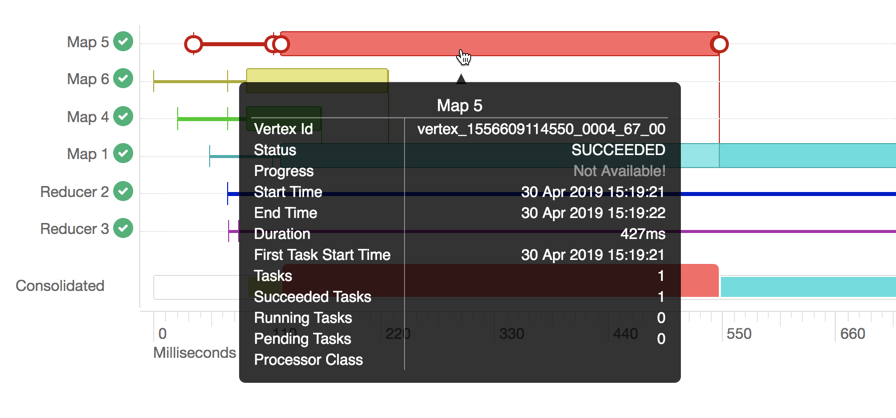
To know more about a particular vertex, hover the mouse pointer anywhere on the horizontal bar, as shown in the following image:
-
Vertex ID: It is a unique identifier for a particular vertex.
-
Status: Indicates whether the query executed successfully or not.
-
Progress: Indicates the progress of the vertex, usually for long-running queries.
-
Start time: Indicates when a particular vertex started.
-
End time: Indicates when the particular vertex ended.
-
Duration (in milliseconds): Indicates the total time taken by the vertex to complete its execution.
-
First task start time: Indicates when the first task within that vertex started its execution.
-
Tasks: Indicates the total number to tasks executed in a particular vertex.
-
Succeeded tasks: Indicates the number of tasks that were executed successfully within that vertex.
-
Running tasks: Indicates the tasks that are still running.
-
Pending tasks: Indicates the tasks that have not yet started their execution.
- Processor class: It is the Hive processor for Tez that forms the vertices in Tez and processes the data. For example, org.apache.hadoop.hive.ql.exec.tez.ReduceTezProcessor, org.apache.hadoop.hive.ql.exec.tez.MapTezProcessor.
The vertical lines connecting two vertices denote the dependency of a vertex on another vertex, as shown in the following image:
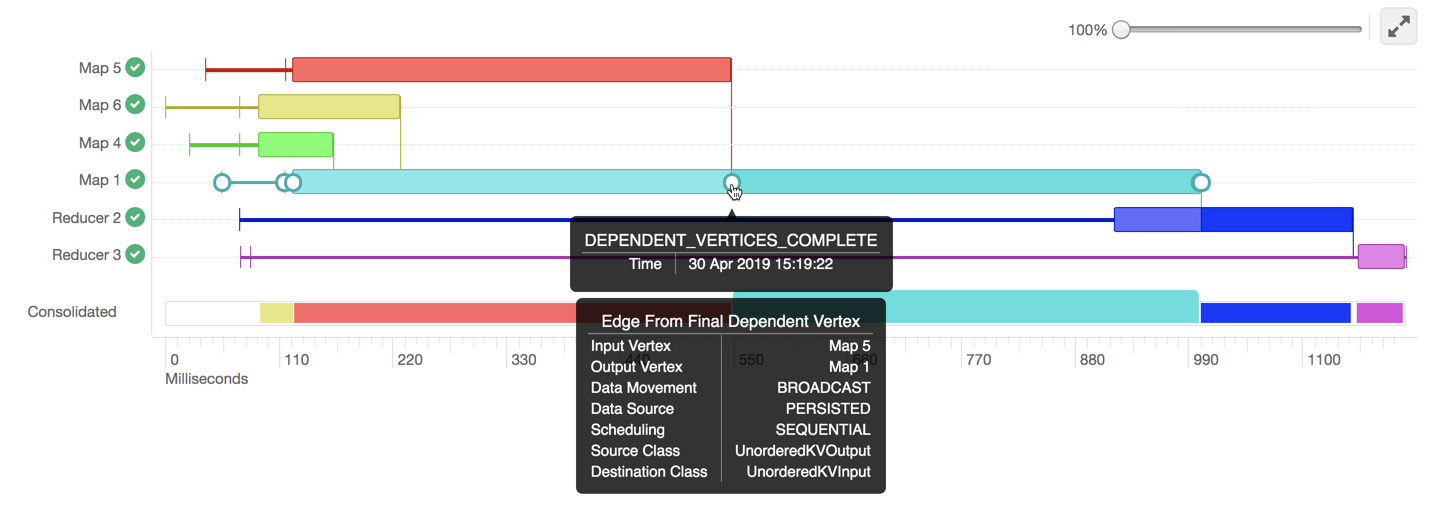
In the above example, Map 1 depends on the results of Map 5. Map 1 will finish its execution only when Map 5 finishes its execution successfully. Similarly, Reducer 2 depends on Map 1 to complete its execution.
The consolidated timeline shows the percentage of time each vertex took to complete executing. You can increase or decrease the scale of the timeline axis by moving the slider on the top right corner of the DAG Info section.
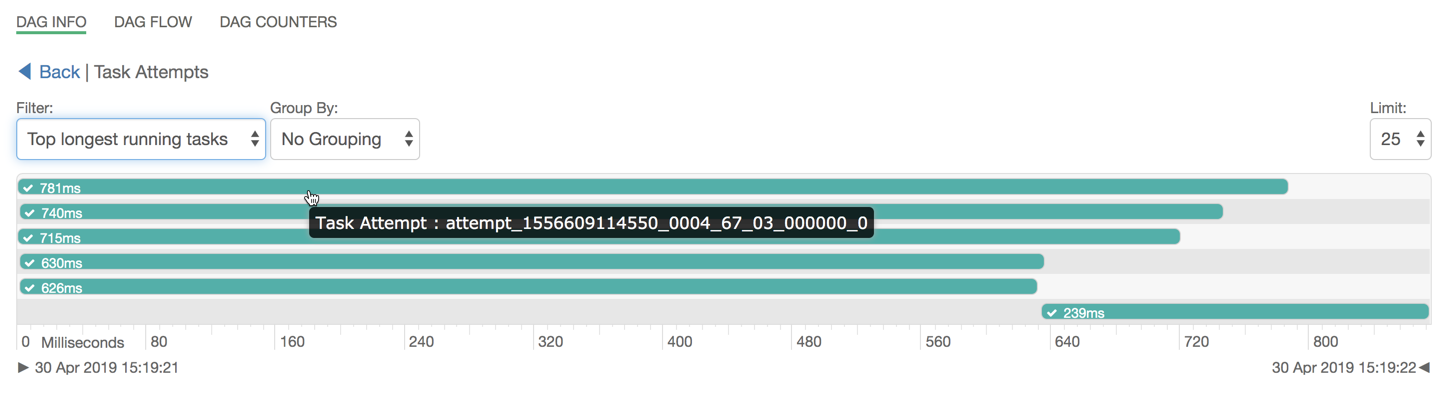
To further debug, click anywhere on the horizontal bar. This takes you to the Task Attempts section. The Task Attempts section shows the number of times a certain task was attempted. Each task attempt has a unique task attempt ID, as shown in the following image:
-
Top longest running tasks: Used to filter the task that took the most time to complete.
-
Errored tasks: Used to filter tasks that stopped because of some error.
-
Tasks which started last: Used to filter the tasks which started late.
You can also group the result set either by tasks, containers in which the tasks were running, or the nodes on which the tasks were running.
DAS also allows you to download detailed logs of a task attempt. The log provides information about the container in which the task was running. To download the logs, click anywhere on the task attempt. On the Details pop-up, click Open log in new tab.
 | Note |
|---|---|
By default, the event logs and the DAG data is retained for seven days, after which
the DAG history is purged from the system. This is defined in the
To change the retention period of these logs and to view task-level DAG information
for older queries, from the Ambari UI, go to , and specify the time to live in the For example, to retain the logs for 30 days and view task-level DAG information for
queries that were run 30 days ago, specify Currently, the task-level logs are disabled for LLAP. |