Monitoring SAM Apps and Identifying Performance Issues
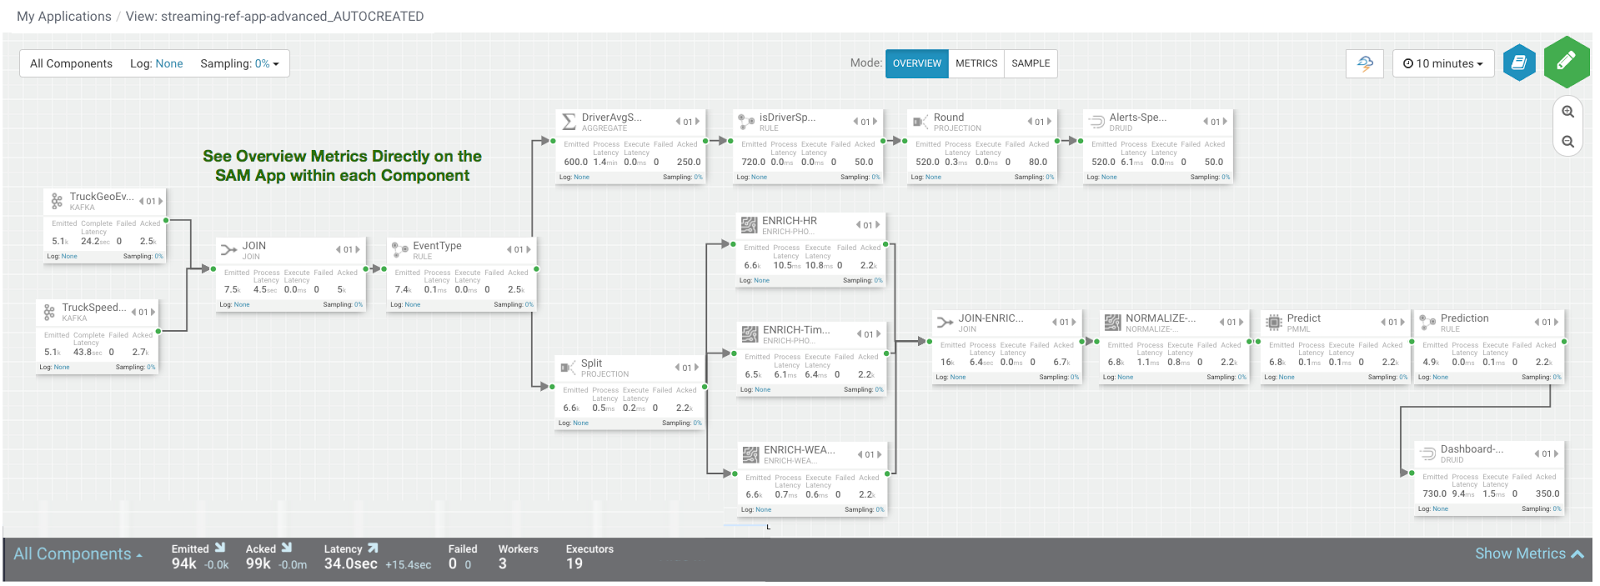
After deploying SAM and running the test generator for about 30 mins, your Storm Operation Mode of the app renders important metrics within each component on the canvas like below.

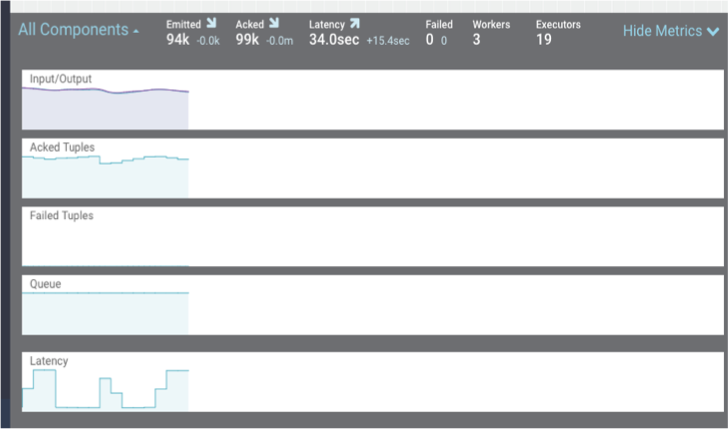
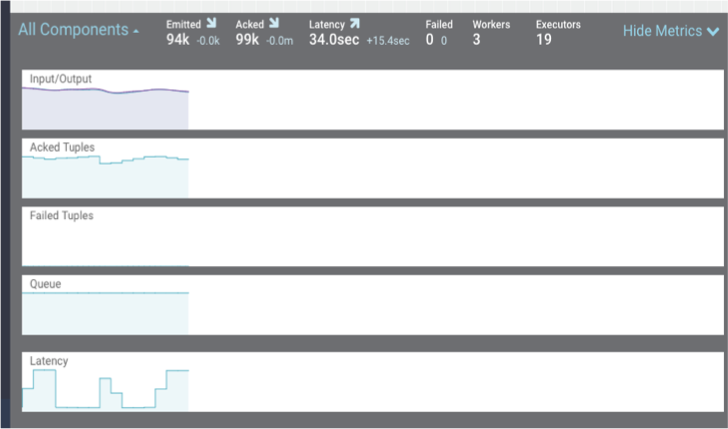
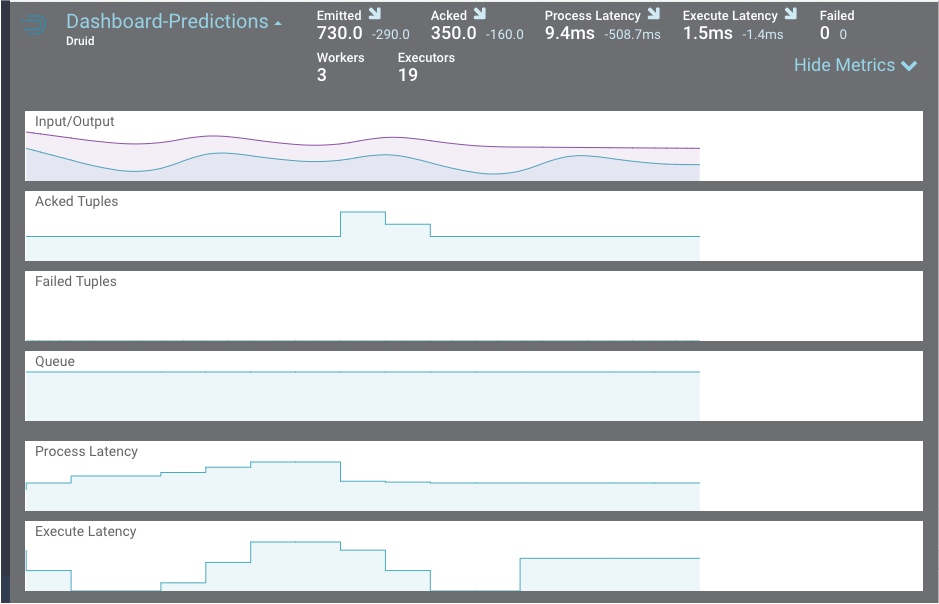
You can click on Show Metrics to get more details on the metrics and drill down on individual metrics. Note the detailed level metrics for All Components, TruckGeoEvent Kafka source, and Dashboard-Predictions Druid Sink.


Key metrics include the following:
| Metric Name | Description |
|---|---|
| Execute Latency | The average time it takes an event to be processed by a given component |
| Process Latency | The average time it takes an event to be acked. Bolts that join, aggregate or batch may not Ack a tuple until a number of other Tuples have been received |
| Complete Latency | How much time an event from source takes to be fully processed and acked by the topology. This metrics is only available for sources (e.g.: Kafka Source) |
| Emitted | The number of events emitted for the given time period. For example, for a Kafka Source, it is the number of events consumed for the given time period |
| Acked | The number of events acked for the given time period. For example, for a Kafka Source, it is the number of events consumed and then acked. |

