
This topic describes best practices for debugging Storm topologies, including basic guidelines for configuring parallelism for individual topology components.
Debugging Storm topologies differs from debugging batch-oriented applications. Because Storm topologies operate on streaming data (rather than data at rest, as in HDFS) they are sensitive to data sources. When debugging Storm topologies, consider the following questions:
What are my data sources?
At what rate do these data sources deliver messages?
What size are the messages?
What is my slowest data sink?
The performance of a Storm topology degrades when it cannot ingest data fast enough to keep up with the data source. In addition, the velocity of incoming streaming data changes over time. When the data flow of the source exceeds what the topology can process, memory buffers fill up and the topology suffers frequent timeouts and must replay tuples to process them. (In contrast, MapReduce applications operate on data at rest in HDFS, with a constant data velocity. These applications suffer from poor latencies, but do not experience the buffer overflows and timeouts associated with streaming applications.)
Hortonworks recommends the following topology debugging technique to identify and overcome poor topology performance due to mismatched data flow rates between source and application.
Click Show Visualization in the Storm UI to display a visual representation of your topology and and find the data bottleneck in your Storm application. Thicker lines between components denote larger data flows. A blue component represents the the first component in the topology, such as the spout below from the WordCountTopology included with
storm-starter. The color of the other topology components indicates whether the component is exceeding cluster capacity: red components denote a data bottleneck and green components indicate components operating within capacity.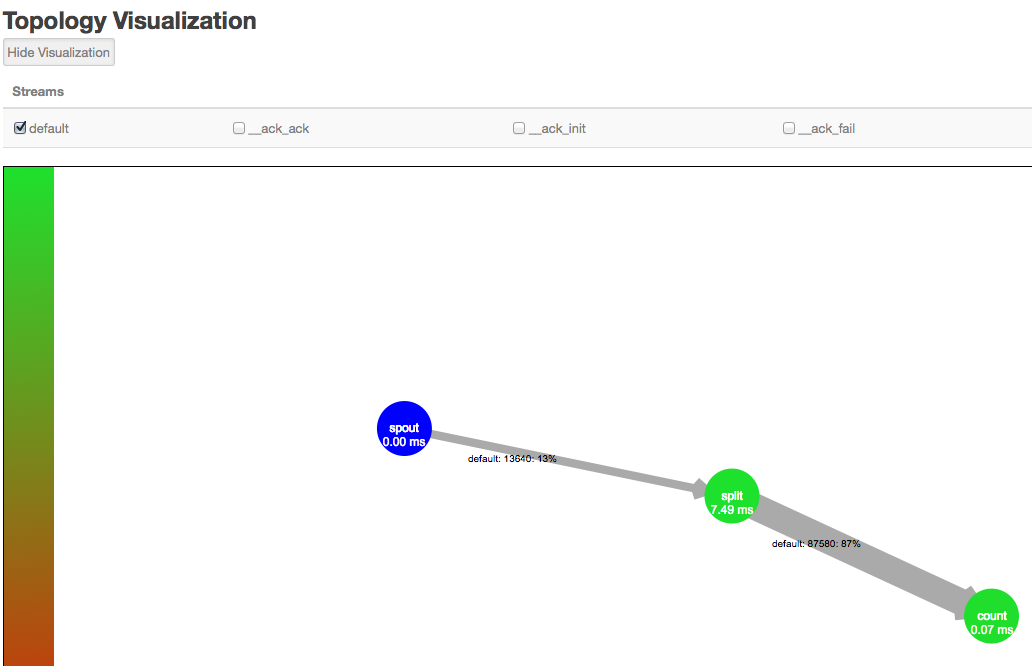
![[Note]](../common/images/admon/note.png)
Note In addition to bolts in your topology, Storm uses its own bolts to perform background work when a topology component acknowledges that it either succeeded or failed to process a tuple. These names of these acker bolts are prefixed with an underscore in the visualization, but do not appear in the default view. You can display the component-specific data about successful acknowledgements by selecting the
_ack_ackcheck box. Select the_ack_failcheckbox to display component-specific data about failed acknowledgements.Verify that you have found the topology bottleneck by rewriting the
execute()method of the target bolt or spout to perform no operations.If the performance of the topology improves, you have found the bottleneck. Alternatively, turn off each topology component, one at a time, to find the component responsible for the processing bottleneck.
Increase the timeout value for the topology.
Edit the value of
topology.message.timeout.secsin the storm.yaml configuration file. The default value is 30 seconds. This configuration parameter controls how long a tuple tree from the core-storm API or a batch from the Trident API has to complete processing before Storm times out and fails the operation.Override the maximum number of tuples or batches waiting for processing before a spout temporarily stops emitting tuples to downstream bolts.
Edit the value of
topology.max.spout.pendingin the storm.yaml configuration file. The default is no limit. Hortonworks recommends that topologies using the core-storm API start with a value of 1000 and slowly decrease the value as necessary. Toplogies using the Trident API should start with a much lower value, between 1 and 5.Increase the parallelism for the target spout or bolt, as described in the next section.
