Creating an AI visual
You can create an AI visual in Cloudera Data Visualization to let users query data through natural language. Before creating the visual, you must configure the required AI engine and data settings, and ensure the dataset meets the requirements for the chosen AI approach (SQL query or similarity search).
Before you start creating the AI visual, make sure the following prerequisites are met.
- Configuration requirements:
-
-
Enable the AI visual in . For more information, see Managing AI settings.
-
Select and configure the AI engine. For more information, see Managing AI settings.
-
Enable data profiling in . For more information, see Managing data related site settings.
-
[optional] Enable speech detection in to support voice input. For more information, see Managing site configuration.
-
- Data requirements:
-
There are no special data requirements if you are using the SQL query AI approach.
If you want to use similarity search as the AI approach, you must connect to a data source that contains a vector column with pre-created embeddings. This can be done in different ways depending on how your data is stored and ingested.
One common method is to upload a CSV file into a supported vector database (Solr or SQLite). For instructions, see Importing data in CSV format .Another option is to use continuous data ingestion. If your dataset is updated continuously (for example stored in an Apache Iceberg table), you can use a data pipeline to:- Convert new records into vector embeddings
- Write them into the connected vector database
Continuous data ingestion allows you to keep the dataset used by the AI visual up to date and relevant with minimal manual effort. Follow the below steps to connect to the required data source.- Ensure the data you plan to use with the AI visual is vectorized and available in a supported vector database (SQLite, Solr 9+, or CSS). This can be from a CSV upload or a continuously updated data source.
- Connect to the vector database that contains your dataset with vector embeddings.
- Create a dataset from the vectorized data. For instructions, see Creating a dataset.
-
In the Dashboard Designer interface, open the
Visuals menu from the side menu bar and click
NEW VISUAL.
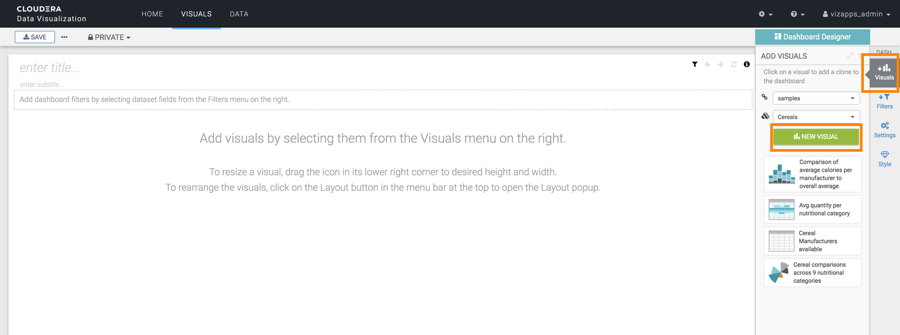
The Visual Builder appears. By default, a table visual is created. For more information, see Visual Builder overview.
-
In the VISUALS menu, click the AI visual icon.
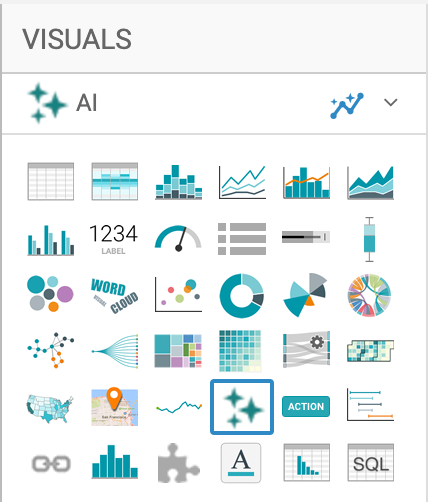
A blank AI visual is added to the dashboard.
The screen also displays the current AI approach (SQL query by default) and the default completion model. You can adjust the AI approach and other settings in the panel.
-
Click from the right-side VISUAL menu and choose
how user queries will be answered.
The following options are available:
-
Use previous data and conversation – Incorporates previous context in the conversation to refine or expand responses to provide more contextual answers. This option is enabled by default.
-
Use SQL query – Generates SQL queries against the connected dataset and summarizes the results. It is enabled by default, and when enabled, it disables similarity search.
-
Enable similarity search – Performs a vector-based search to find the most relevant records to answer the query. When enabled, SQL query is disabled automatically. This option is only available for SQlite, Solr 9+, and CSS datasets.
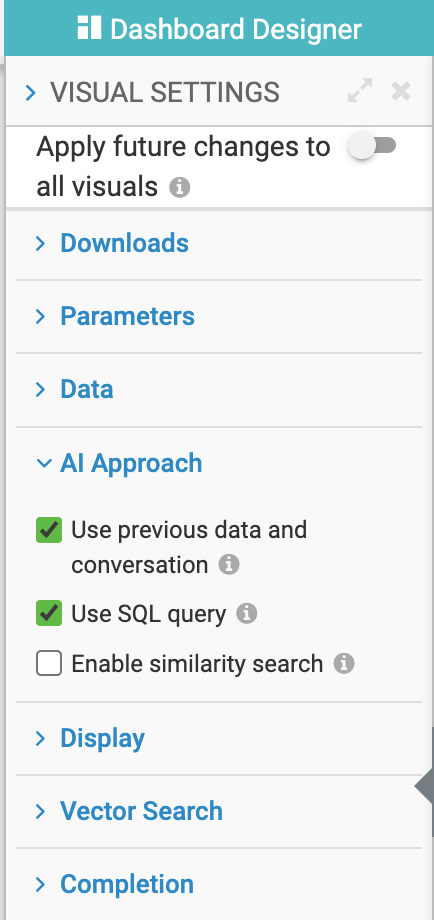
To use the AI visual, you must select either SQL query or similarity search. With both options, you can also include previous data and conversation context.
If you are using SQL query, continue with Step 5.
If you are using similarity search, first you need to populate the shelves of the AI visual.
-
Switch back to the Build menu and populate the AI visual shelves from the fields listed in the DATA pane.
-
Embeddings: Add vector fields containing embeddings that you want the AI model to analyze in a semantic way.
-
Context Dimensions: Add fields to group or segment embedding results into categories.
-
Context Aggregates: Add aggregated fields that summarize data for similar records in the AI visual. This allows the AI visual to better answer questions related to quantities, distributions, and comparisons.
-
Tooltip: Define the source information to be included in the response tooltip. This information appears when the user hovers over the response's Info icon, but it is not sent to the completion service.
-
Limit: Define the maximum number of data rows retrieved from the vector database and analyzed.
-
-
Click REFRESH VISUAL.
-
[Optional] If you are using similarity search, you can configure embedding and completion related settings. Click from the right-side VISUAL menu to:
- Set the maximum number of tokens. You can use 0 or a negative value to disable this setting
- Change the default profile
- Provide a template for vector search responses
-