Cloudera Data Visualization allows you to create Word Cloud visuals that
aggregate text data and highlight the most frequently occurring words. This visual type is
useful for emphasizing prominent terms or phrases in textual datasets. It offers a variety of
customizable display settings.
The following example uses the Shakespeare's Sonnets dataset. To learn how to create
datasets, see Creating a dataset. For an overview of the shelves that specify
this visual, see Shelves for word clouds.
Start a new visual based on the Shakespeare's Sonnets dataset.
For detailed instructions on how to get started, see Creating a
visual.
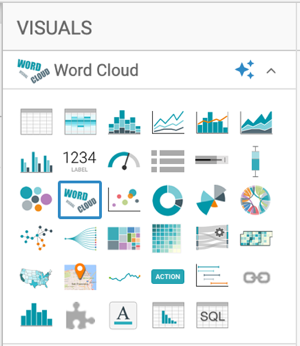
In the VISUALS menu, select Word
Cloud.
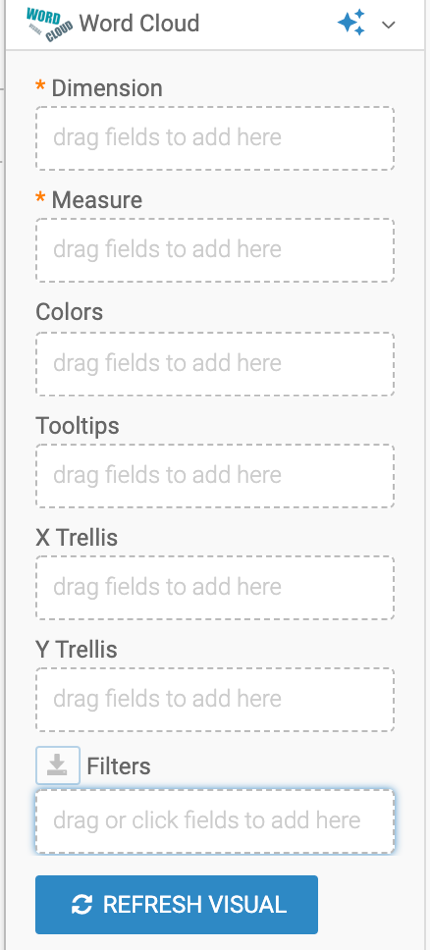
The shelves for this visual type are: Dimension,
Measure, Colors,
Tooltips, X Trellis, Y
Trellis, and Filters. The mandatory shelves are
Dimension and Measure.
Populate the shelves using the available dataset fields:
Drag Text to the Dimension shelf.
Drag Record Count to the Measure
shelf.
Click REFRESH VISUAL.
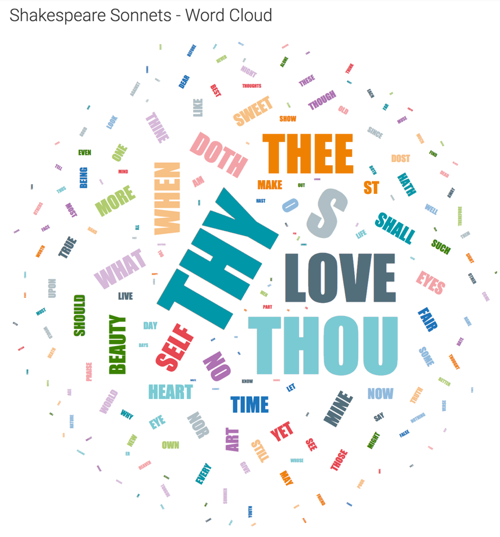
Click the icon next to the visual title to enter a name for it.
In this example, the title is changed to 'Shakespeare Sonnets - Word Cloud'.
Optionally, add a subtitle for a brief description.
In the top left corner of the Dashboard Designer, click
SAVE.
The resulting visual displays a word cloud where more frequent words appear larger.
Customizing the visual
You can adjust how the Word Cloud is displayed using the available settings for this
visual type. Explore the settings panel for font styles, color options, word rotation,
and more.
Comparing texts
To compare multiple texts visually, consider using trellised word clouds. For more
details, see Trellised word clouds
 icon next to the visual title to enter a name for it.