Troubleshooting flow deployment errors
Learn how to recognize and address common errors with your Cloudera Data Flow flow deployments.
Setting up kubectl to connect to the Kubernetes cluster
It is helpful to have access to the Kubernetes cluster using command line tools such as kubectl when you are troubleshooting deployment or upgrade failures. To set up kubectl access, follow these steps:
- In , from the Environments page, select the service for which you want to add or remove user access.
- Click Manage .
- From the Actions menu, click Manage Kubernetes API Server User Access.
- Add the AWS IAM role that you will authenticate as to the list of authorized users for by entering the ARN in the Add User dialog.
- Use the Download Kubeconfig action to retrieve the kubeconfig file for connecting to your cluster.
- Set up your kubectl to use the downloaded
kubeconfig
file:
export KUBECONFIG=[***PATH/TO/DOWNLOADED/KUBECONFIG/FILE***] - Run
kubectl get nsand validate that your output looks similar to: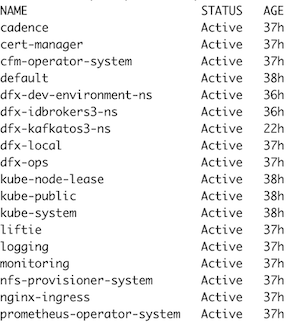
With kubectl being set up correctly, you are able to access NiFi and other logs directly through the CLI.
Understanding flow deployment failures
The Flow Deployment process consists of two phases:
- Scheduling resources on Kubernetes and creating a new NiFi cluster:
- Importing, configuring, and starting the NiFi flow definition:
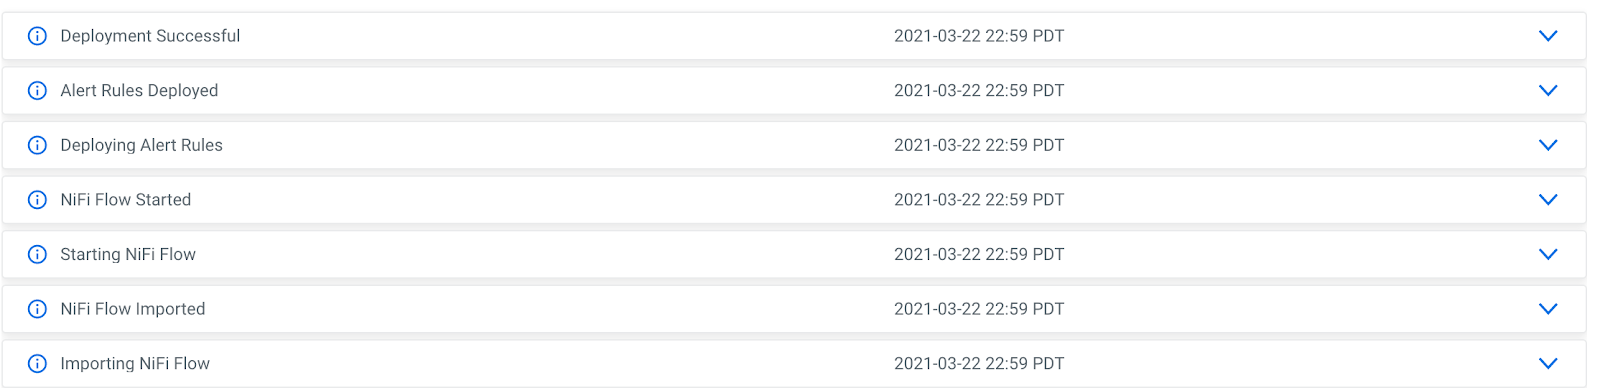
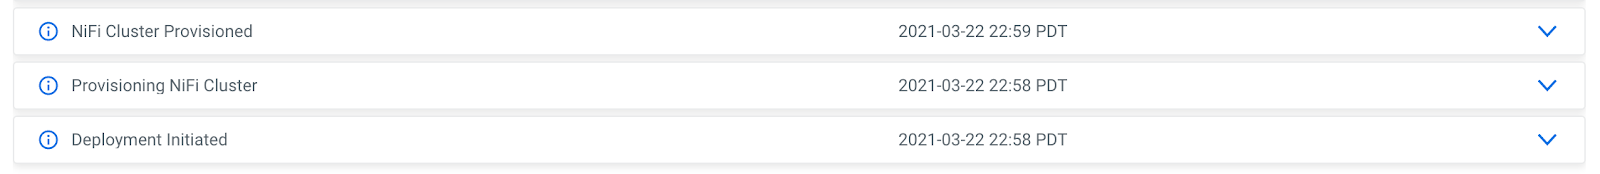
If your flow deployment fails, check the Event History to see where exactly the issue occurred.
Deployment fails during Phase 1
If the issue occurs during Phase 1 while scheduling resources on Kubernetes and creating the NiFi cluster, you can get more details on why the deployment failed by looking at the Cloudera Data Flow application logs.
Identify the Cloudera Data Flow application pod by running:
kubectl get pods
--namespace dfx-local
The result should look similar to
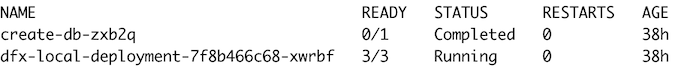
Copy the dfx-local-deployment pod ID and run to view the Cloudera Data Flow application logs.
kubectl logs \
  -f dfx-local-deployment-7f8b466c68-xwrbf \
  -c dfx-local \
--namespace dfx-localA common reason for flow deployment issues is that the Kubernetes cluster does not have enough resources available for the deployment pods to be scheduled. Pods that are stuck in pending are an indicator for not enough resources being available.
You can explore flow deployments and their resources by running:
get pods --namespace dfx-deployment_name-ns 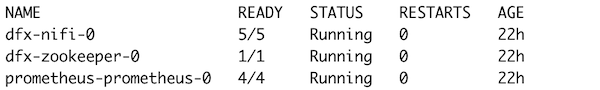
If one of the pods is stuck in Pending you can explore the pod further and identify any potential issues by looking at its events.
kubectl describe pod dfx-nifi-0 -n dfx-deployment_name-nsFind the Events section and check if there are any messages about why a container could not be scheduled.
If the flow deployment failed because of insufficient resources in the Kubernetes cluster, you can increase the Kubernetes cluster size by using the Edit Configuration action of the affected environment.
Deployment fails during Phase 2
If the issue occurs during Phase 2, check the NiFi canvas of the deployment for any error messages. To get there, open the deployment details, click Manage Deployment and in the following Deployment Manager page select the view in NiFi action.
If a processor or controller service failed to start, make sure that you have provided the correct values for the deployment parameters. You can adjust parameter values in the NiFi canvas and restart processors or controller services as needed. Once you have identified the issue, note down the correct parameter values and start a new deployment.
To view the NiFi log for a particular deployment run the following kubectl command.
kubectl logs -f dfx-nifi-0 -c app-log --namespace dfx-deployment_name-nsTroubleshooting using a diagnostic bundle
You can collect diagnostic logs in a bundle and optionally send them to Cloudera support either using the start-get-diagnostics-collection CLI command, or using the Unified Diagnostics feature of the Cloudera Management Console. For more information, see Collecting diagnostic bundle using CLI and Collecting diagnostic bundle using Unified Diagnostics.