Enabling Grafana dashboard in COD
Learn how to enable the Grafana URL to visualize the Cloudera Operational Database (COD) metrics.
- You must whitelist the Cloudera archive URL so that the necessary RPM packages for Grafana can be installed in the instances.
- You must whitelist the Cloudera repository so that the dashboards are created automatically.
- You must whitelist the Grafana RPM packages URL so that Grafana can be installed in the instances.
- You must whitelist the Google API storage URL so that the Cloudera Manager fousquare plugin can be installed.
- You must attach the following policy for CloudWatch plugin under
cdp-infra2-logs-role (or the role with which the
ec2 instances are created) to enable the Amazon S3 metrics in Grafana
dashboard. To attach a policy under the
cdp-infra2-logs-rolee, see Create a
cross-account IAM
role.
{ "Version": "2012-10-17", "Statement": [ { "Sid": "AllowReadingMetricsFromCloudWatch", "Effect": "Allow", "Action": [ "cloudwatch:DescribeAlarmsForMetric", "cloudwatch:DescribeAlarmHistory", "cloudwatch:DescribeAlarms", "cloudwatch:ListMetrics", "cloudwatch:GetMetricStatistics", "cloudwatch:GetMetricData", "cloudwatch:GetInsightRuleReport" ], "Resource": "*" }, { "Sid": "AllowReadingLogsFromCloudWatch", "Effect": "Allow", "Action": [ "logs:DescribeLogGroups", "logs:GetLogGroupFields", "logs:StartQuery", "logs:StopQuery", "logs:GetQueryResults", "logs:GetLogEvents" ], "Resource": "*" }, { "Sid": "AllowReadingTagsInstancesRegionsFromEC2", "Effect": "Allow", "Action": [ "ec2:DescribeTags", "ec2:DescribeInstances", "ec2:DescribeRegions" ], "Resource": "*" }, { "Sid": "AllowReadingResourcesForTags", "Effect": "Allow", "Action": "tag:GetResources", "Resource": "*" }, { "Sid": "AllowReadingAcrossAccounts", "Effect": "Allow", "Action": [ "oam:ListSinks", "oam:ListAttachedLinks" ], "Resource": "*" } ] } - You must also create a CloudWatch metrics configuration to enable the Amazon S3 metrics in Grafana dashboard. See the steps mentioned under Using the S3 console in Creating a CloudWatch metrics configuration for all the objects in your bucket.
On successfully executing the command, Grafana URL is added under the GRAFANA DASHBOARD option inside the COD database as shown in the following figure.
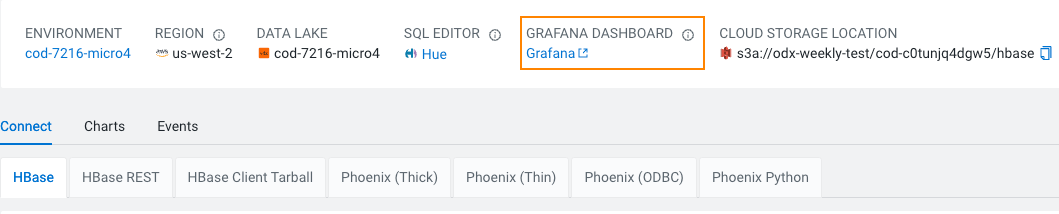
When you click on the Grafana URL, it takes you to the Grafana dashboard.
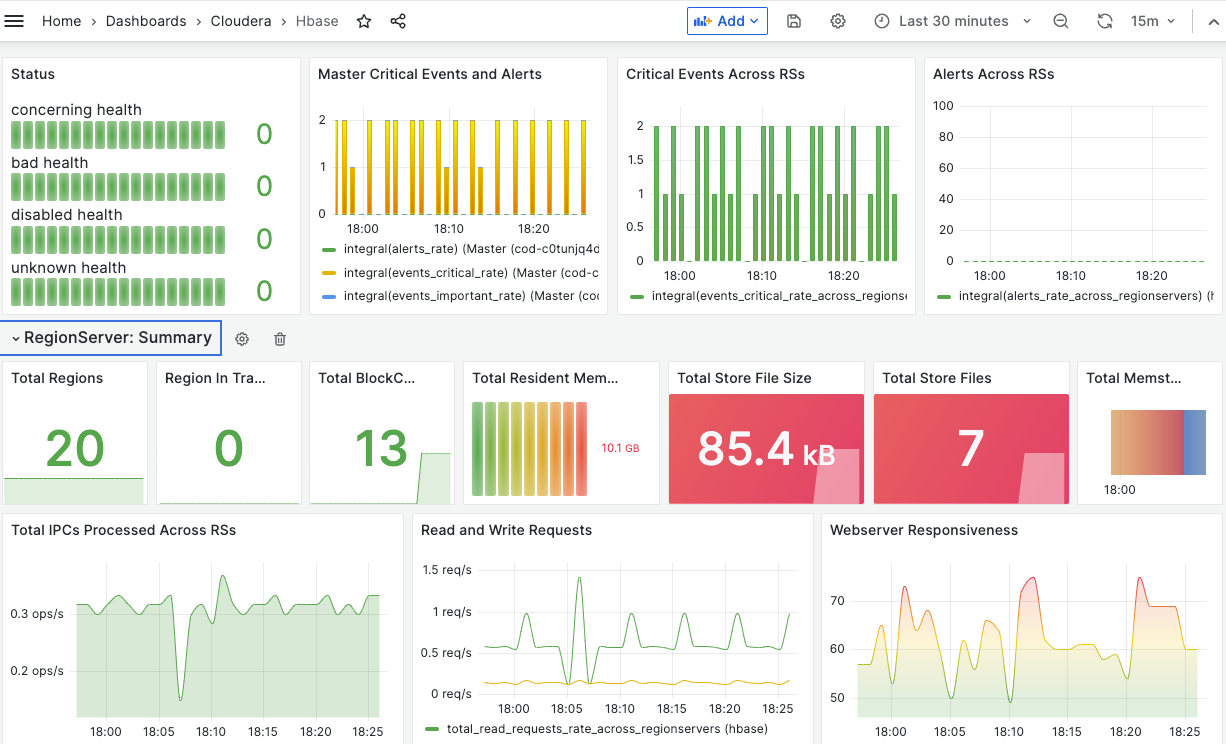
Here is an example of the HBase dashboard using Grafana.