

Viewing Cluster-Wide Metrics
From the Metrics tab, you can also view the following cluster-wide metrics:
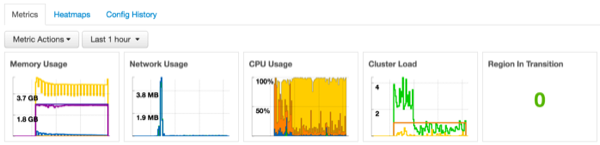
These metrics widgets show the following information:
- Memory usage
Cluster-wide memory used, including memory that is cached, swapped, used, and shared
- Network usage
The cluster-wide network utilization, including in-and-out
- CPU Usage
Cluster-wide CPU information, including system, user and wait IO
- Cluster Load
Cluster-wide Load information, including total number of nodes. total number of CPUs, number of running processes and 1-min Load
You can customize this display as follows:
To remove a widget
Click the white X.
To magnify the chart or itemize the widget display
Hover your cursor over the widget.
To remove or add metrics
Select the item on the widget legend.
To see a larger view of the chart
Select the magnifying glass icon.
Ambari displays a larger version of the widget in a separate window:
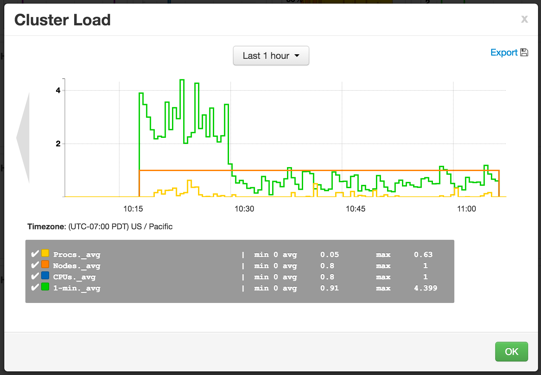
You can use the larger view in the same ways that you use the dashboard.
To close the larger view, click OK.