

Chapter 3. Understanding the UI
Overview Page
From the Overview page you can quickly identify any issues with, or verify the health of, the clusters, policies, or jobs in Data Lifecycle Manager (DLM).
Cluster Health Panel
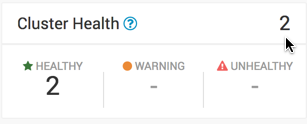
You can use the Cluster Health panel of the Overview page to view the total number of clusters enabled for Data Lifecycle Manager, the number that are healthy, the number for which a warning is issued, and the number that are unhealthy .
- Healthy
Specifies the total number of clusters currently available to run replication jobs. The DLM Engine can be reached and all services are running.
- Warning
Specifies the total number of clusters for which remaining disk capacity is less than 10%.
If this value is greater than zero, you can click the number to open a table that displays the cluster name and remaining capacity.
- Unhealthy
Specifies the total number of clusters for which at least one Apache Ambari service required for DLM (DLM Engine, HDFS, Apache Hive, or Apache Knox) is not started. If this value is greater than zero, you can click the number to open a table that displays the cluster name and the names of any Ambari services that have stopped.
Policies Panel
You can use the Policies panel of the Overview page to view the total number of policies in use and their status.
- Active
Specifies policies with status of Submitted or Running. This item is not actionable
- Suspended
Specifies policies that have been suspended by an administrator. This item is not actionable.
- Unhealthy
Specifies policies associated with any cluster designated as Unhealthy in the Cluster Health panel. If the value is greater than zero, the number becomes clickable. You can click the number to display a table that contains the policy name, the names of the source and destination clusters, and which services are stopped on the source or destination cluster.
Jobs Panel
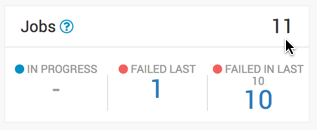
You can use the Jobs panel of the Overview page to view the total number of running and failed jobs and their status.
- In Progress
Specifies the number of jobs with the status Running. If the value is greater than zero, the number becomes clickable. You can click the number to apply a filter to the Issues and Updates table, so that the table displays only in-progress jobs. The filter label Jobs: In Progress appears above the table. Running jobs display as a blue dot in the Policy History column of the table.
- Failed Last
Specifies the last job that completed with status Failed. If the value is greater than zero, the number becomes clickable. You can click the number to apply a filter to the Issues and Updates table, so that the table displays only policies for which the last job had a status of Failed. The filter label Jobs: Failed Last appears above the table. Failed jobs display as a red dot in the Policy History column of the table.
- Failed in Last 10
Indicates the number of policies for which at least one of the last 10 jobs completed with status Failed. If the value is greater than zero, the number becomes clickable. You can click the number to apply a filter to the Issues and Updates table, so that the table displays only policies for which at least one job failed out of the last 10 jobs. The filter label Jobs: Failed Last appears above the table. Failed jobs display as a red dot in the Policy History column of the table.
Recent Issues Panel
Shows the last four events with severity of warning, critical, or error. For each event, the panel shows the severity, the type, a message that includes the policy name and file icon, and the age of the event.
- Severity icon
Displays in orange for warning and red for critical or error.
- Event type
Displays in bold text above the event message. The type can be succeeded, deleted, or suspended.
- Event message
Displays as text under the event name. When an event is associated with a policy or policy instance (job), then the message text contains two items:
Policy name: You can click this term to navigate to the Policies page with a preset filter that displays information about only the selected policy.
File icon: You can move the cursor over the icon to display the text “View Log” and click the text to display log content for the associated policy or job.
- Event age
Displays in numeric form how long ago from the current time the event occurred.
You can click View All at the bottom of the event list to navigate the browser to the Notifications page.
Clusters Map
Shows red, orange, and green markers that indicate the geolocation of each cluster.
Red: At least one required service has stopped on the cluster.
Orange: All required services are running but the remaining capacity on a cluster is less than 10%.
Green: All required services are running and remaining disk capacity is greater than 10%.
You can move the cursor over a marker on the map displays a tooltip specifying the data center associated with the cluster, the cluster name, and the number of DLM policies that are associated with that cluster.
You can click a marker to open a panel showing the same information as in the tooltip, plus a Launch Ambari link. Clicking the link opens a new browser tab with the login page for the Ambari host for that cluster.
If the dot is red, the panel also displays a list of services that are in a Stopped state in Ambari.
Issues & Updates Table
The Issues & Updates table shows policies that have running jobs but at least one failed out of the most recent 10 jobs. You do not see any policy if its last 10 jobs were all successful. Table columns include the following:
- Job Status
When the status of a job is Running, a status circle icon and progress bar display. For jobs that are not running, a status circle icon displays along with the text Success, Failed, or Ignored. You can move the cursor over a Failed status to see a “View Log” tooltip, which you can click to see the job log.
- Source & Destination
The names of the source and destination clusters associated with the policy.
- Service
Indicates whether the data being replicated is from HDFS or Hive.
- Policy
The name assigned to the policy.
- Policy History
Shows up to 10 job statuses as colored dots.
Color Status Description Green Succeeded Job completed with no issues. Red Failed Job did not complete. Gray Ignored Job did not start because a previous instance of the policy was still in progress. Only one run of a job can be in progress at one time. If a job is consistently ignored, you might need to modify its frequency. Clicking the colored dots navigates the browser to the Policies page, with the filter preset to show information only about the specified policy.
- Transferred/Files
The amount of data transferred, in gigabytes, and the number of objects transferred, if available. When a job is running, the column displays In Progress.
- Runtime
How long it took to run the most recent job.
- Started
When the most recent job started.
- Ended
When the most recent job ended.
- Actions icon
Abort Job: Aborts a running job. Enabled only when the job status is Running.
Re-run Job: Starts another instance of the policy. Disabled when a job is executing.
Delete Policy: Removes a policy from Data Lifecycle Manager. Delete cannot be undone. Always enabled.
Suspend Policy: Suspends the policy and any job that is executing. Disabled when the policy status is Suspended.
Activate Policy: Resumes a suspended policy. Disabled when the policy status is Running.