Integrating Apache Hive with Kafka, Spark, and BI
Also available as:
PDF

Configure a Superset visualization

In Apache Ambari, after connecting Apache Superset to Apache Hive, you can configure visualizations, such as aggregations, slices of data, or plotted data to better understand the data.

This task shows you how to create a simple visualization based on a table having the following schema:
CREATE TABLE students (name VARCHAR(64), age INT, gpa DECIMAL(3,2));
  • You created and populated a table in the Hive warehouse.
  1. Select Superset from the Ambari main menu.
  2. In Summary under Quick Links, click Superset.
  3. From the Sources menu, select Tables.
  4. In Add Filter, add a new record.
  5. On Add Table in Database, select the Hive database connected to Superset.
  6. In Table Name, select a Hive table, students in the example below, and click Save.
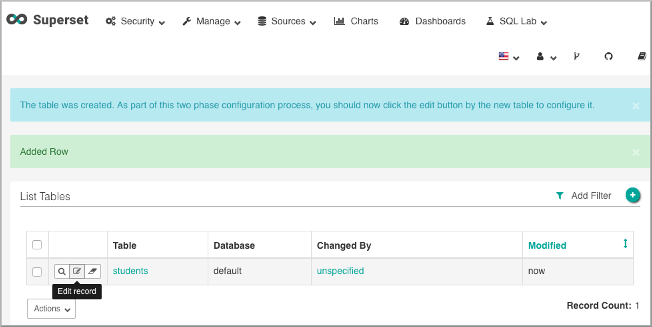
  7. On List Tables, click Edit Record:
    List of Hive tables registered in Superset
  8. On the Detail tab of Edit Table, in Table Name, enter the name of a table in the Hive database.
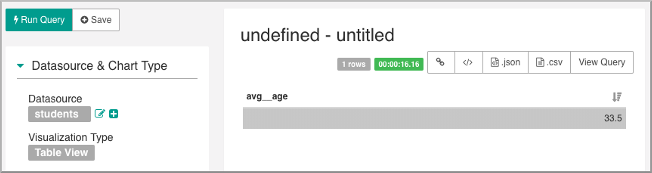
    A table visualization appears, showing an aggregation calculated automatically by Superset: average age 33.5 in this example:
    datasource students - visualization type table view - avg_age