Apache Atlas dashboard tour
The Apache Atlas New UI dashboard summarizes entity health, classification usage, and metadata activity, while the Classic UI landing page provides a global search interface.
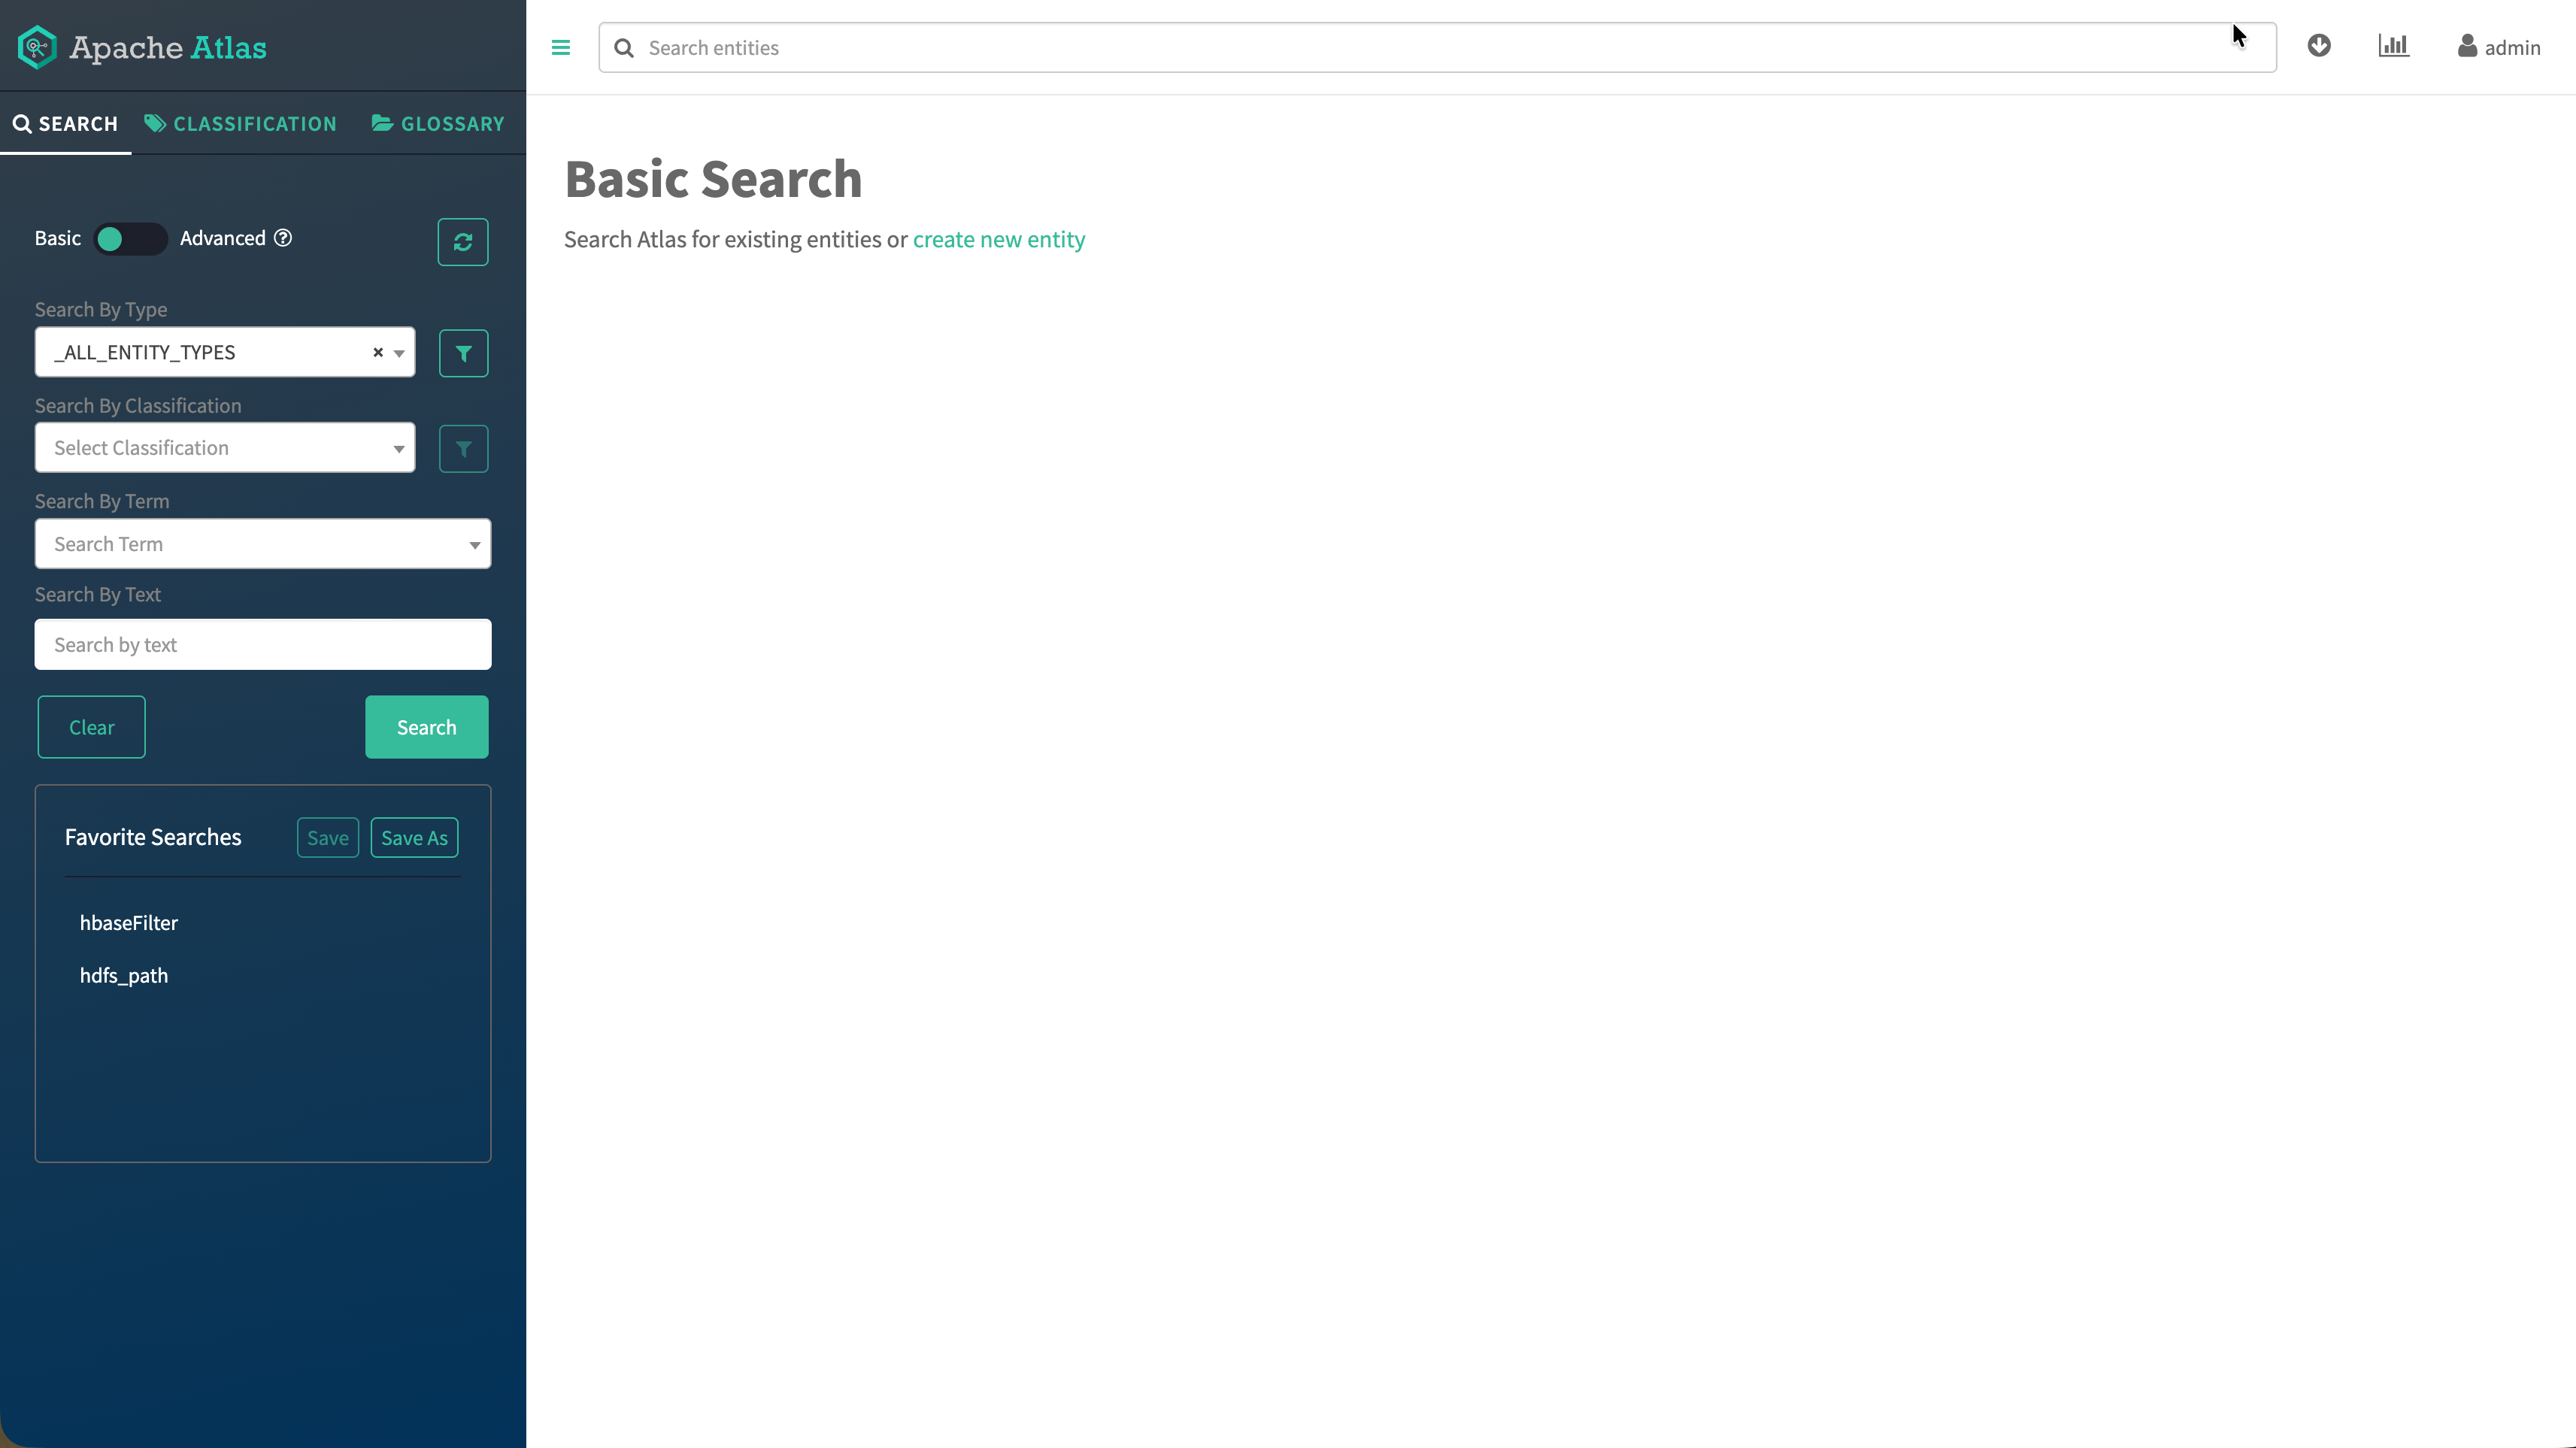
You can switch between the Classic UI and the redesigned, React-based New UI. In the New UI, the default landing view is an overview dashboard, while the Classic UI retains the search-centric layout.
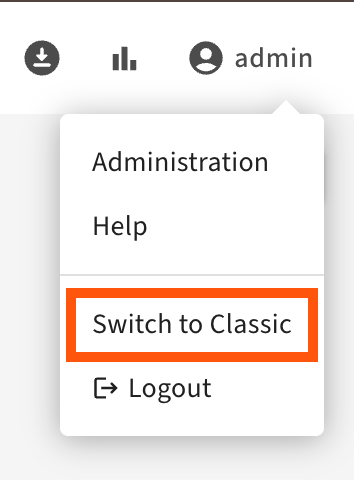
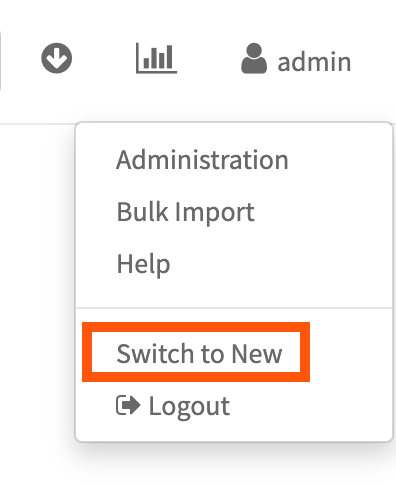
The Atlas user interface is a metadata workspace with the following parts:
- Basic Search panel on the left.
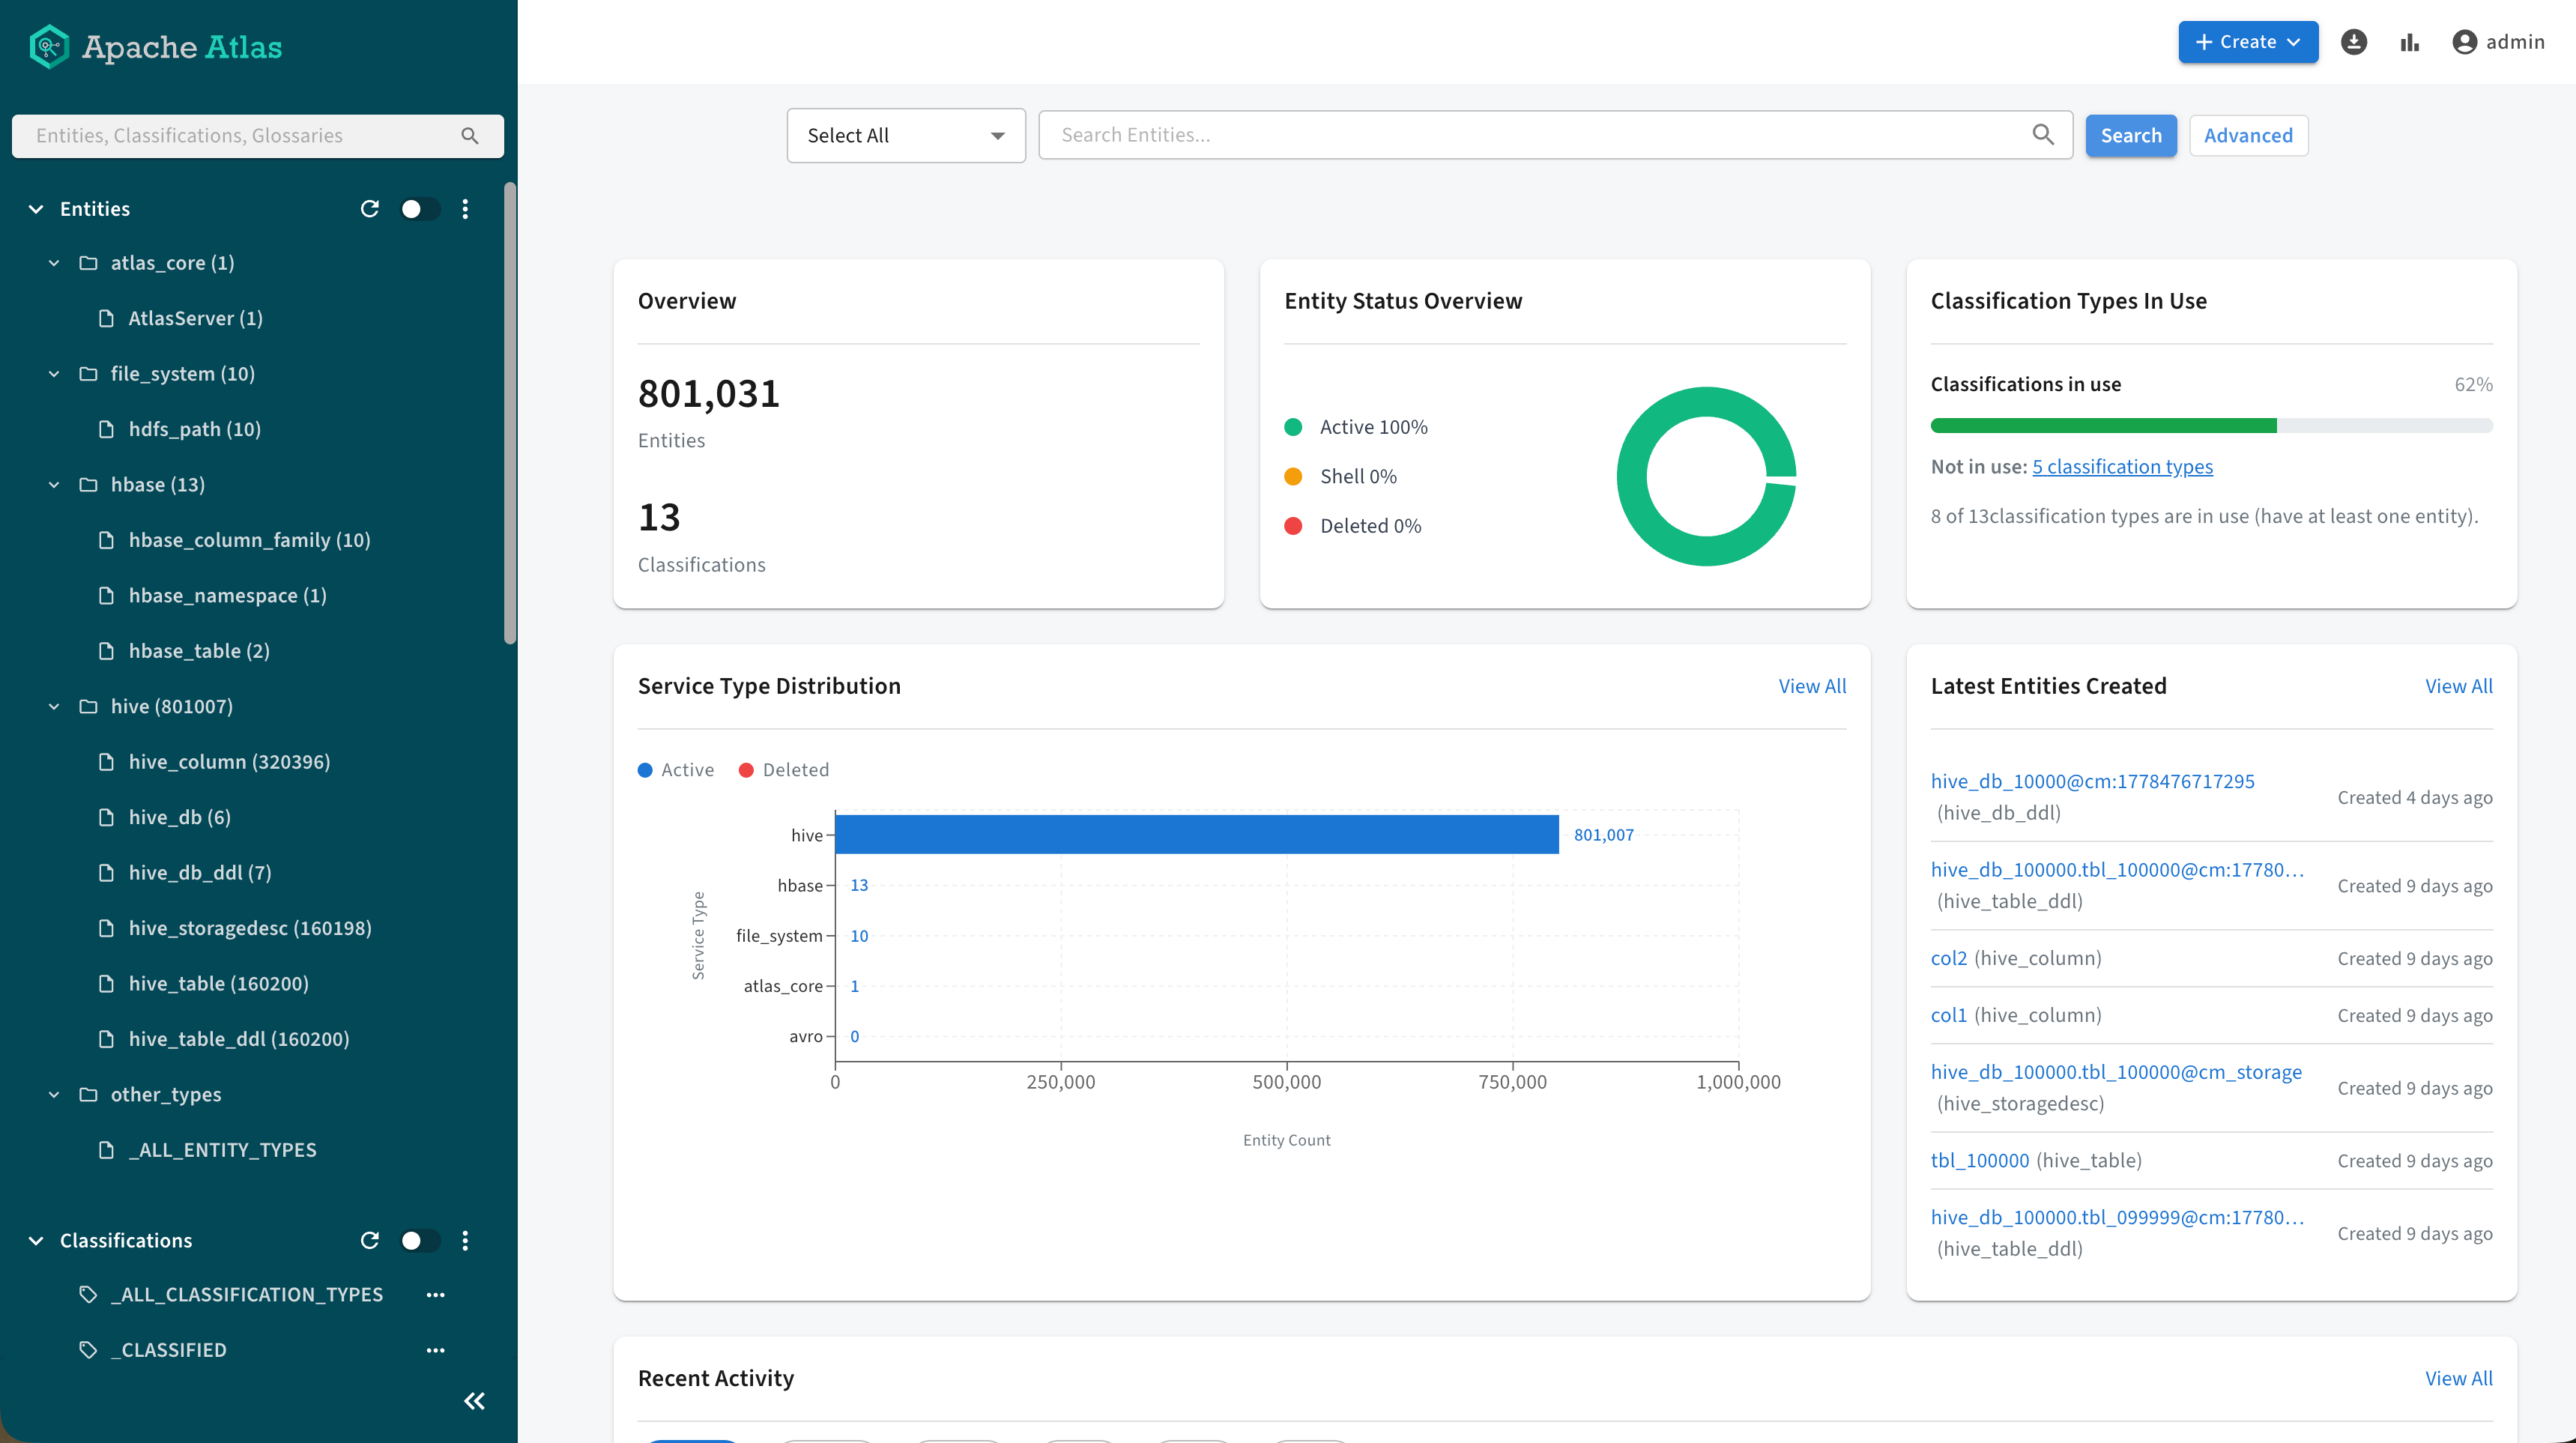
- Detail panel on the right (topped by the Global Search field) where search results are displayed or the overview cards for the New UI. You can drill into a specific entity to view its details. Each detail page contains a header section and a series of tabbed panels, all of which are oriented to the metadata for that entity type.
New UI dashboard overview
In the New UI, the main workspace hosts dashboard cards that summarize metadata volume, distribution, and operational events. Together, they give you a snapshot before you open the Search panel or an entity detail page.
- Overview Shows aggregate counts for entities and classifications
registered in Atlas. Clicking the Entities count triggers the
general search for all entities. Clicking the Classification count
triggers a search filtered to classifications.
Figure 3. Overview section with aggregated entity and classification counts 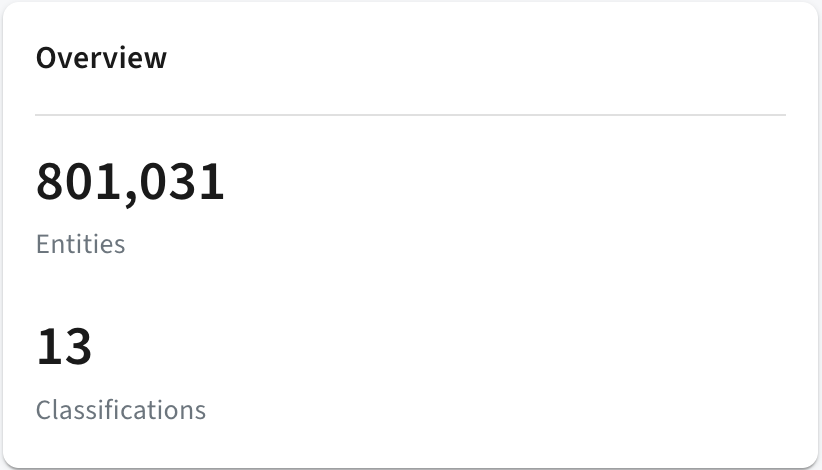
- Entity Status Overview Displays doughnut chart for entity counts
by the Active, Shell, and
Deleted lifecycle states. Clicking the individual statuses
triggers filtered searches.
Figure 4. Entity Status Overview section with lifecycle states 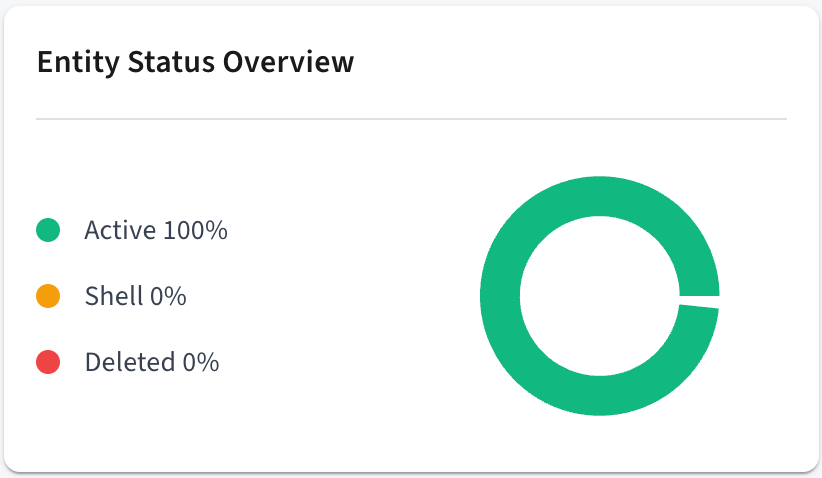
- Classification Types In Use Lists classification types currently
applied across assets. By clicking the green part of the classification distribution bar,
you can trigger a search for each asset with a classification. Clicking the grey part
displays the list of unused classifications and open their details.
Figure 5. Classification Types In Use section with used and unused classification types 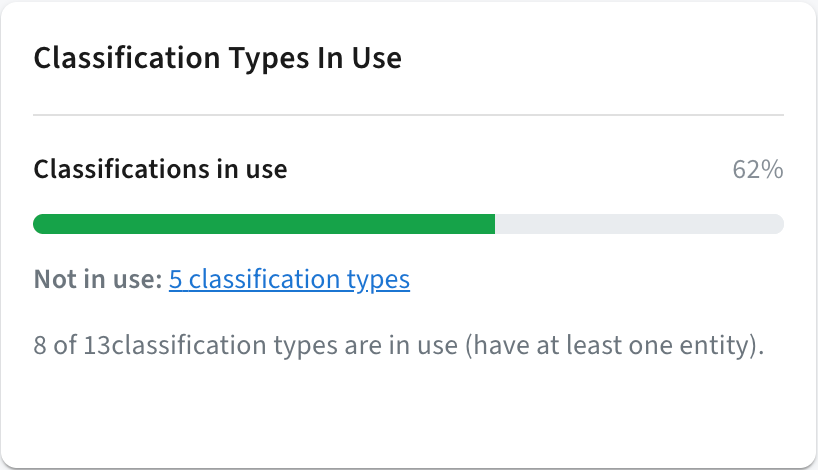
- Service Type Distribution Displays chart of entity counts by Atlas
service type to highlight dominant metadata categories. Clicking the service types trigger
searches filtered to all entity types relevant to that service. For example, the
hive service type triggers a search filtered to Hive columns,
such as
hive_column_lineages,hive_dbs, andhive_processes.Figure 6. Service Type Distribution section with a service type-based bar chart 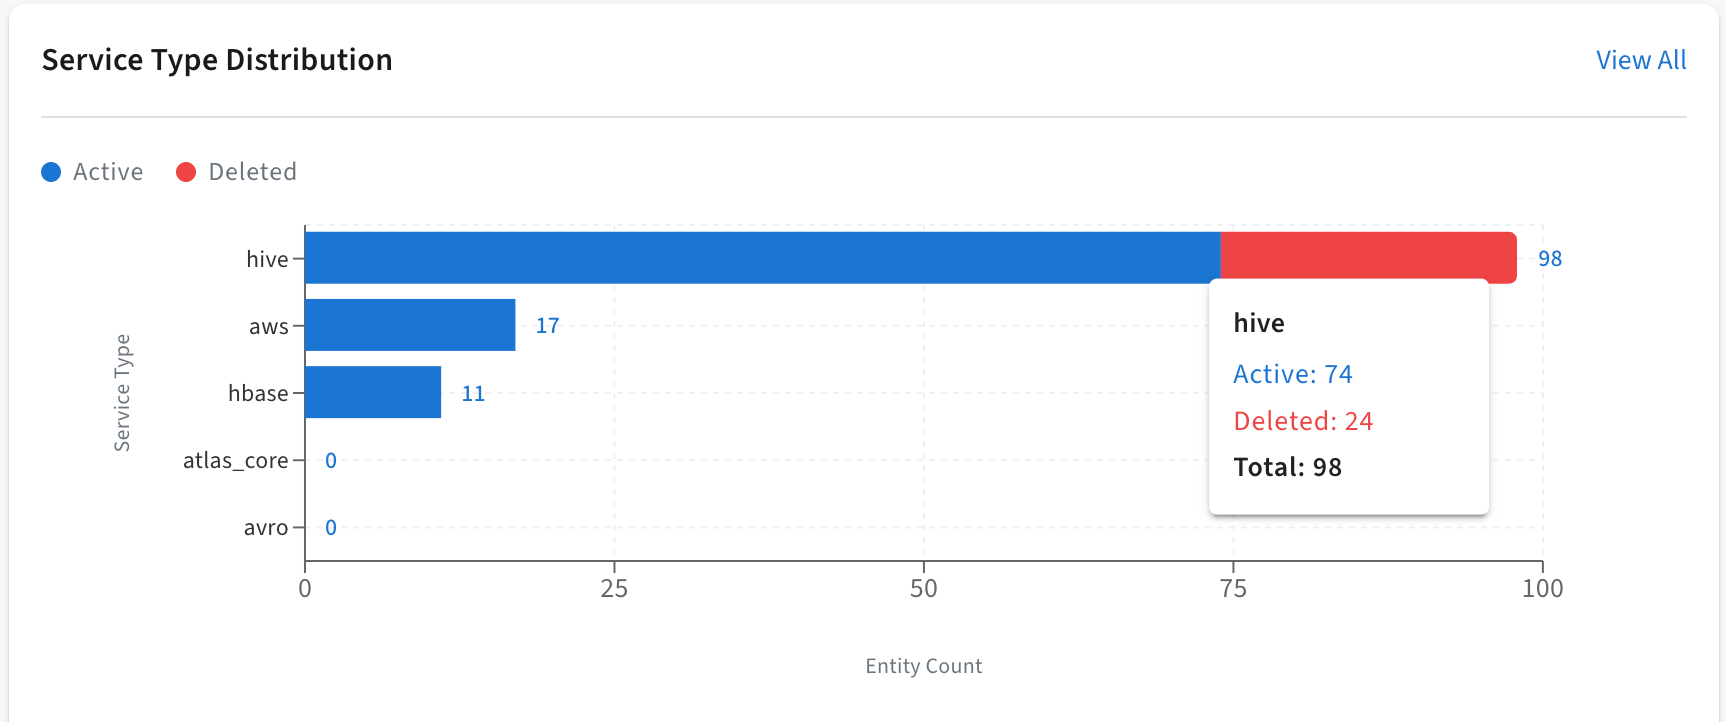
- Latest Entities Created Displays a table of the most recently
discovered or registered entities for quick drill-down.
Figure 7. Latest Entities Created section 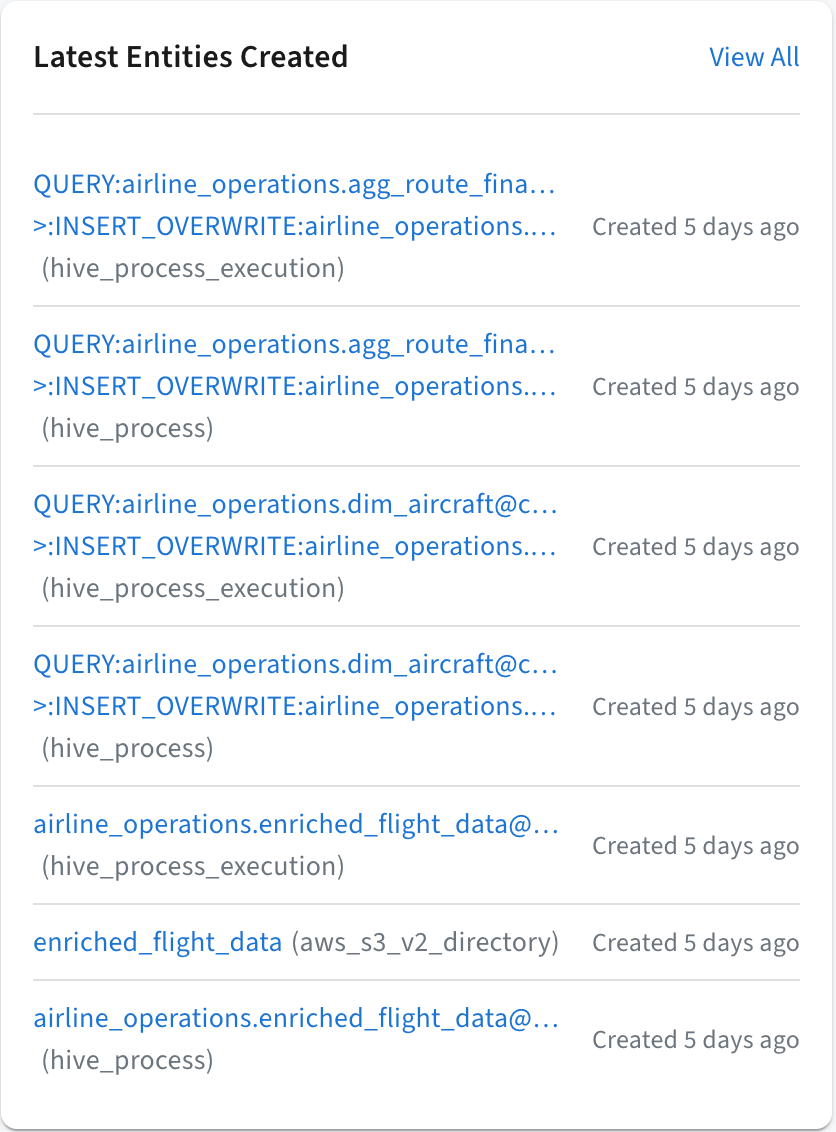
- Recent Type Definition Activity Displays a timeline-style feed of
the Created, Updated,
Deleted, Purge,
Import, and Export operations. You can
switch between the operation types to update the list.
Figure 8. Recent Type Definition Activity section with notable operations 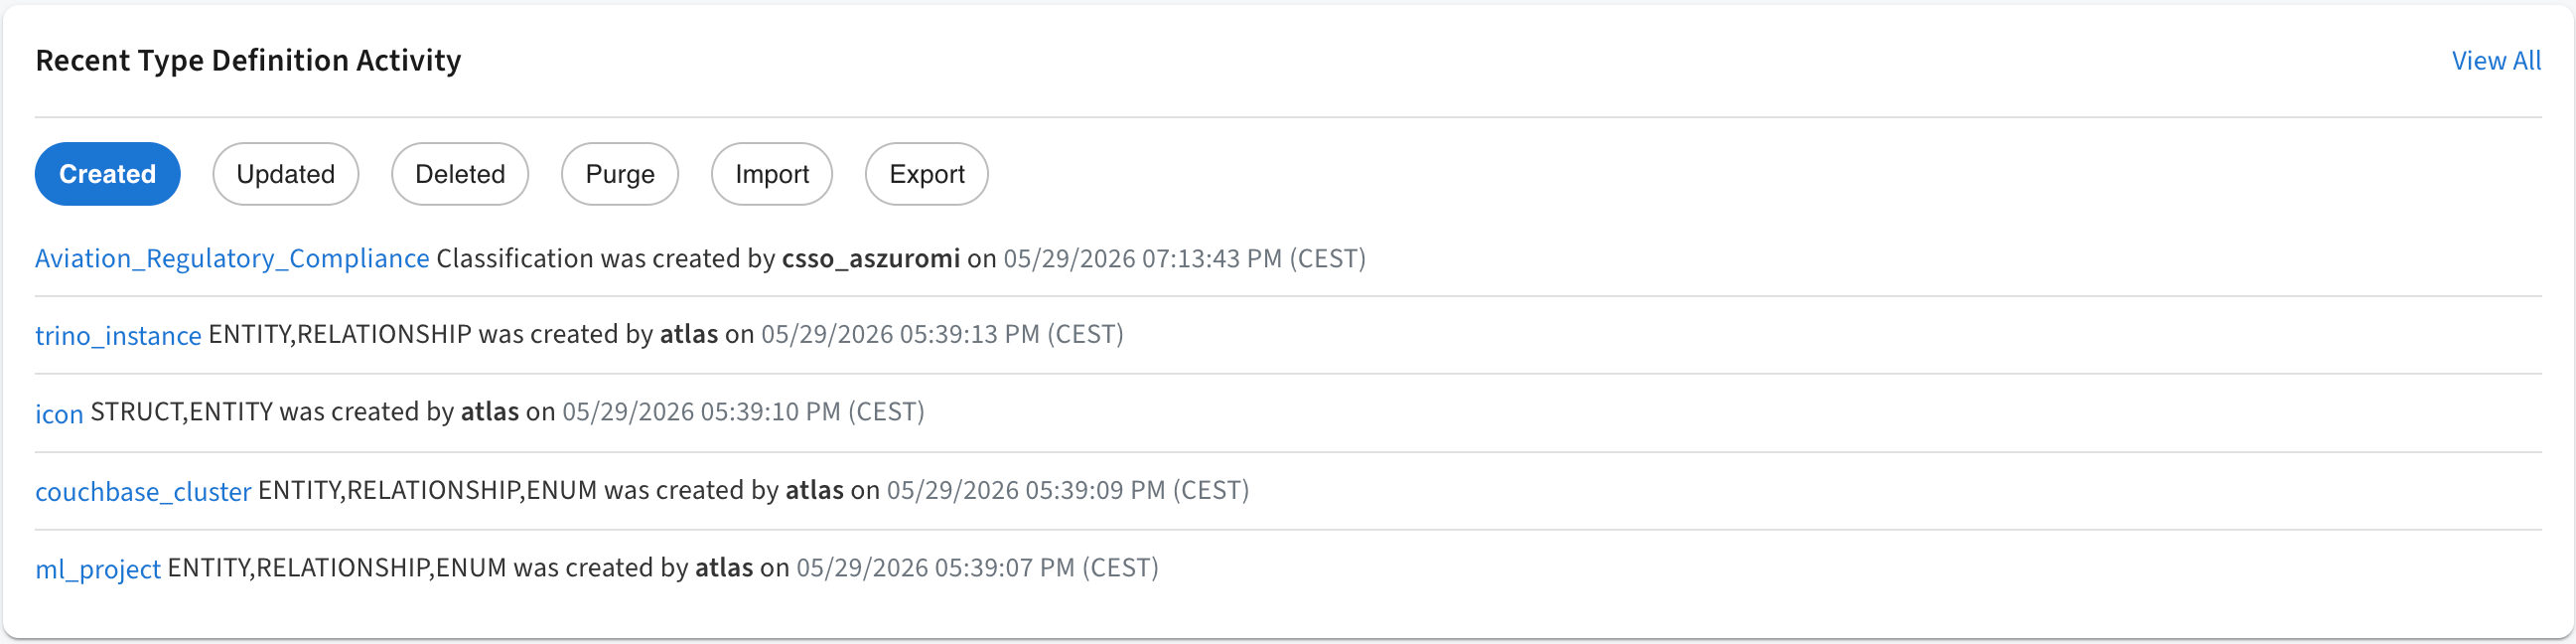
- Classification Distribution Displays a bar chart using the order of
the most used classifications. By clicking the classifications in the graph, you can
trigger searches filtered to them.
Figure 9. Classification Distribution section with the most used classification types 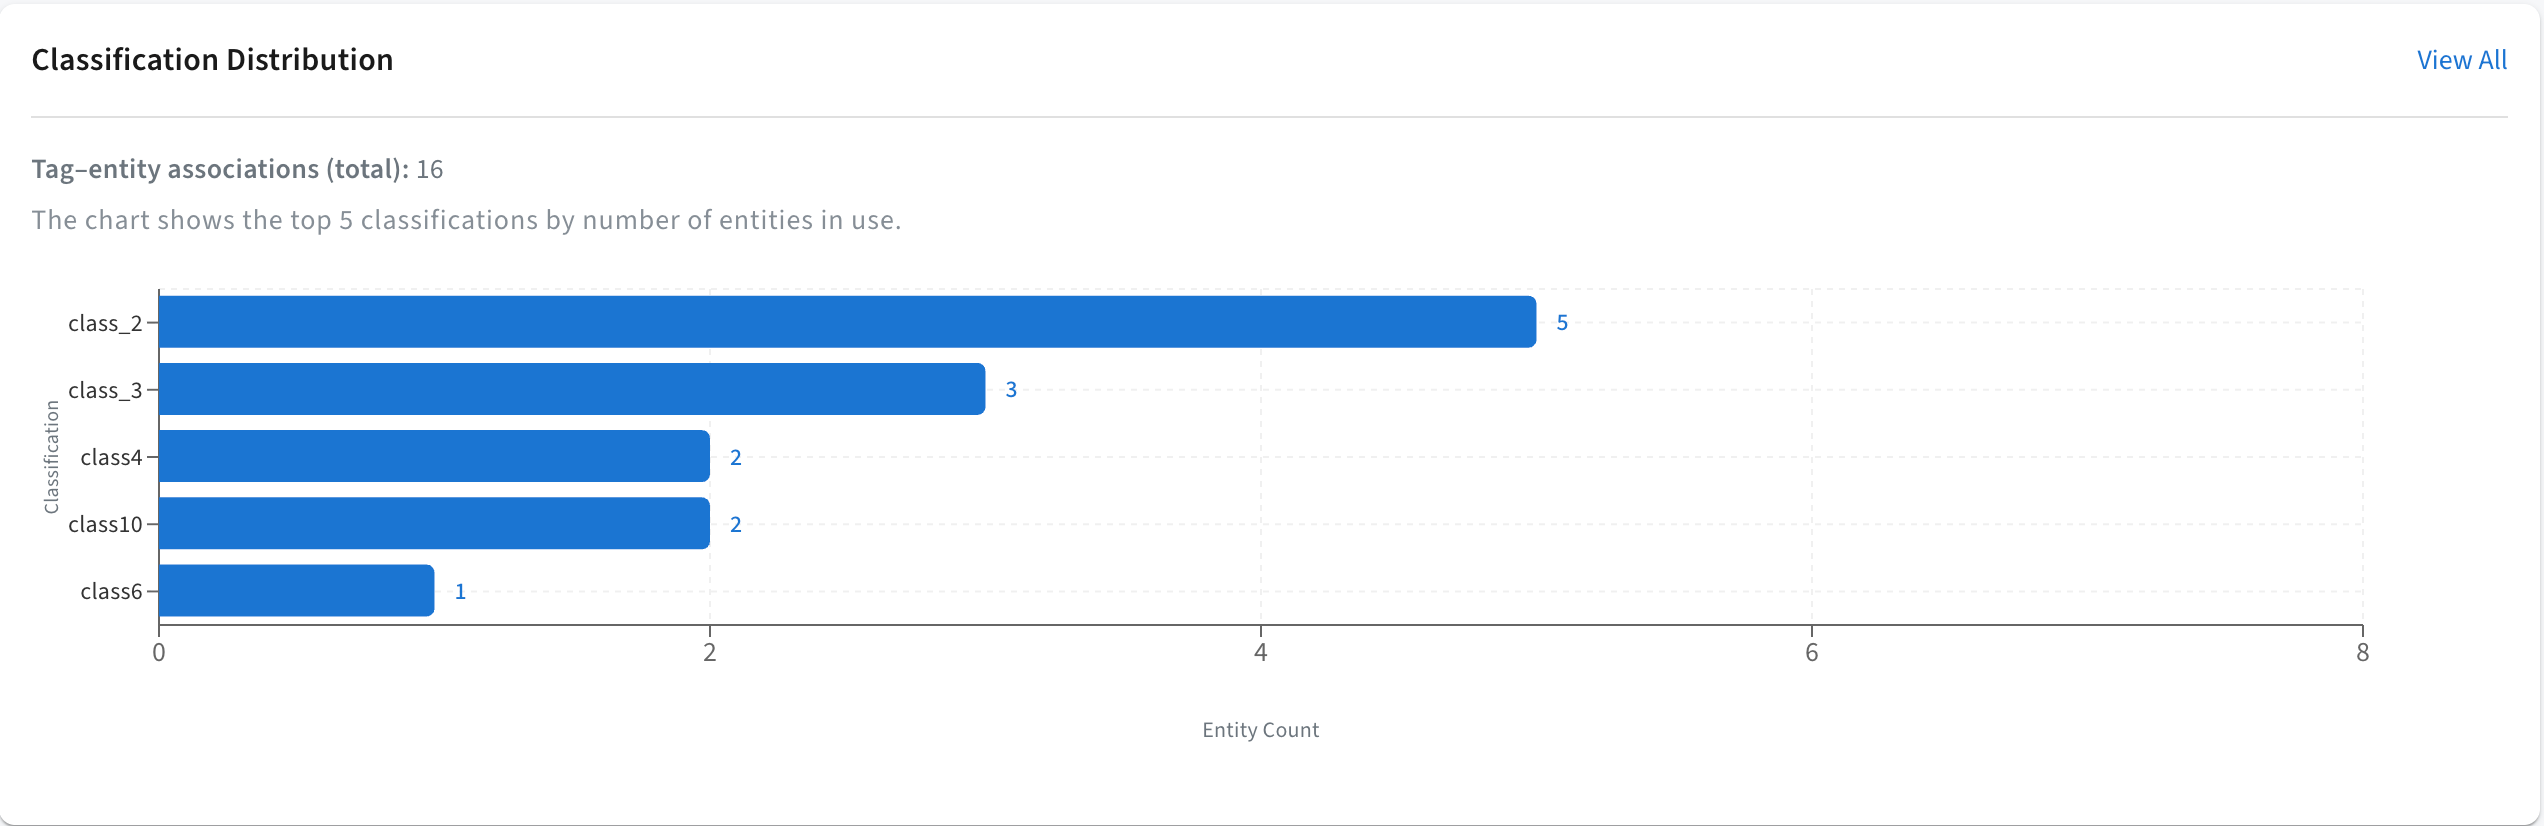
- Kafka Topic Summary Summarizes Kafka-related metadata surfaced by
Atlas, for example topics ingested into the catalog, so you can validate streaming assets
at a glance.
Figure 10. Kafka Topic Summary 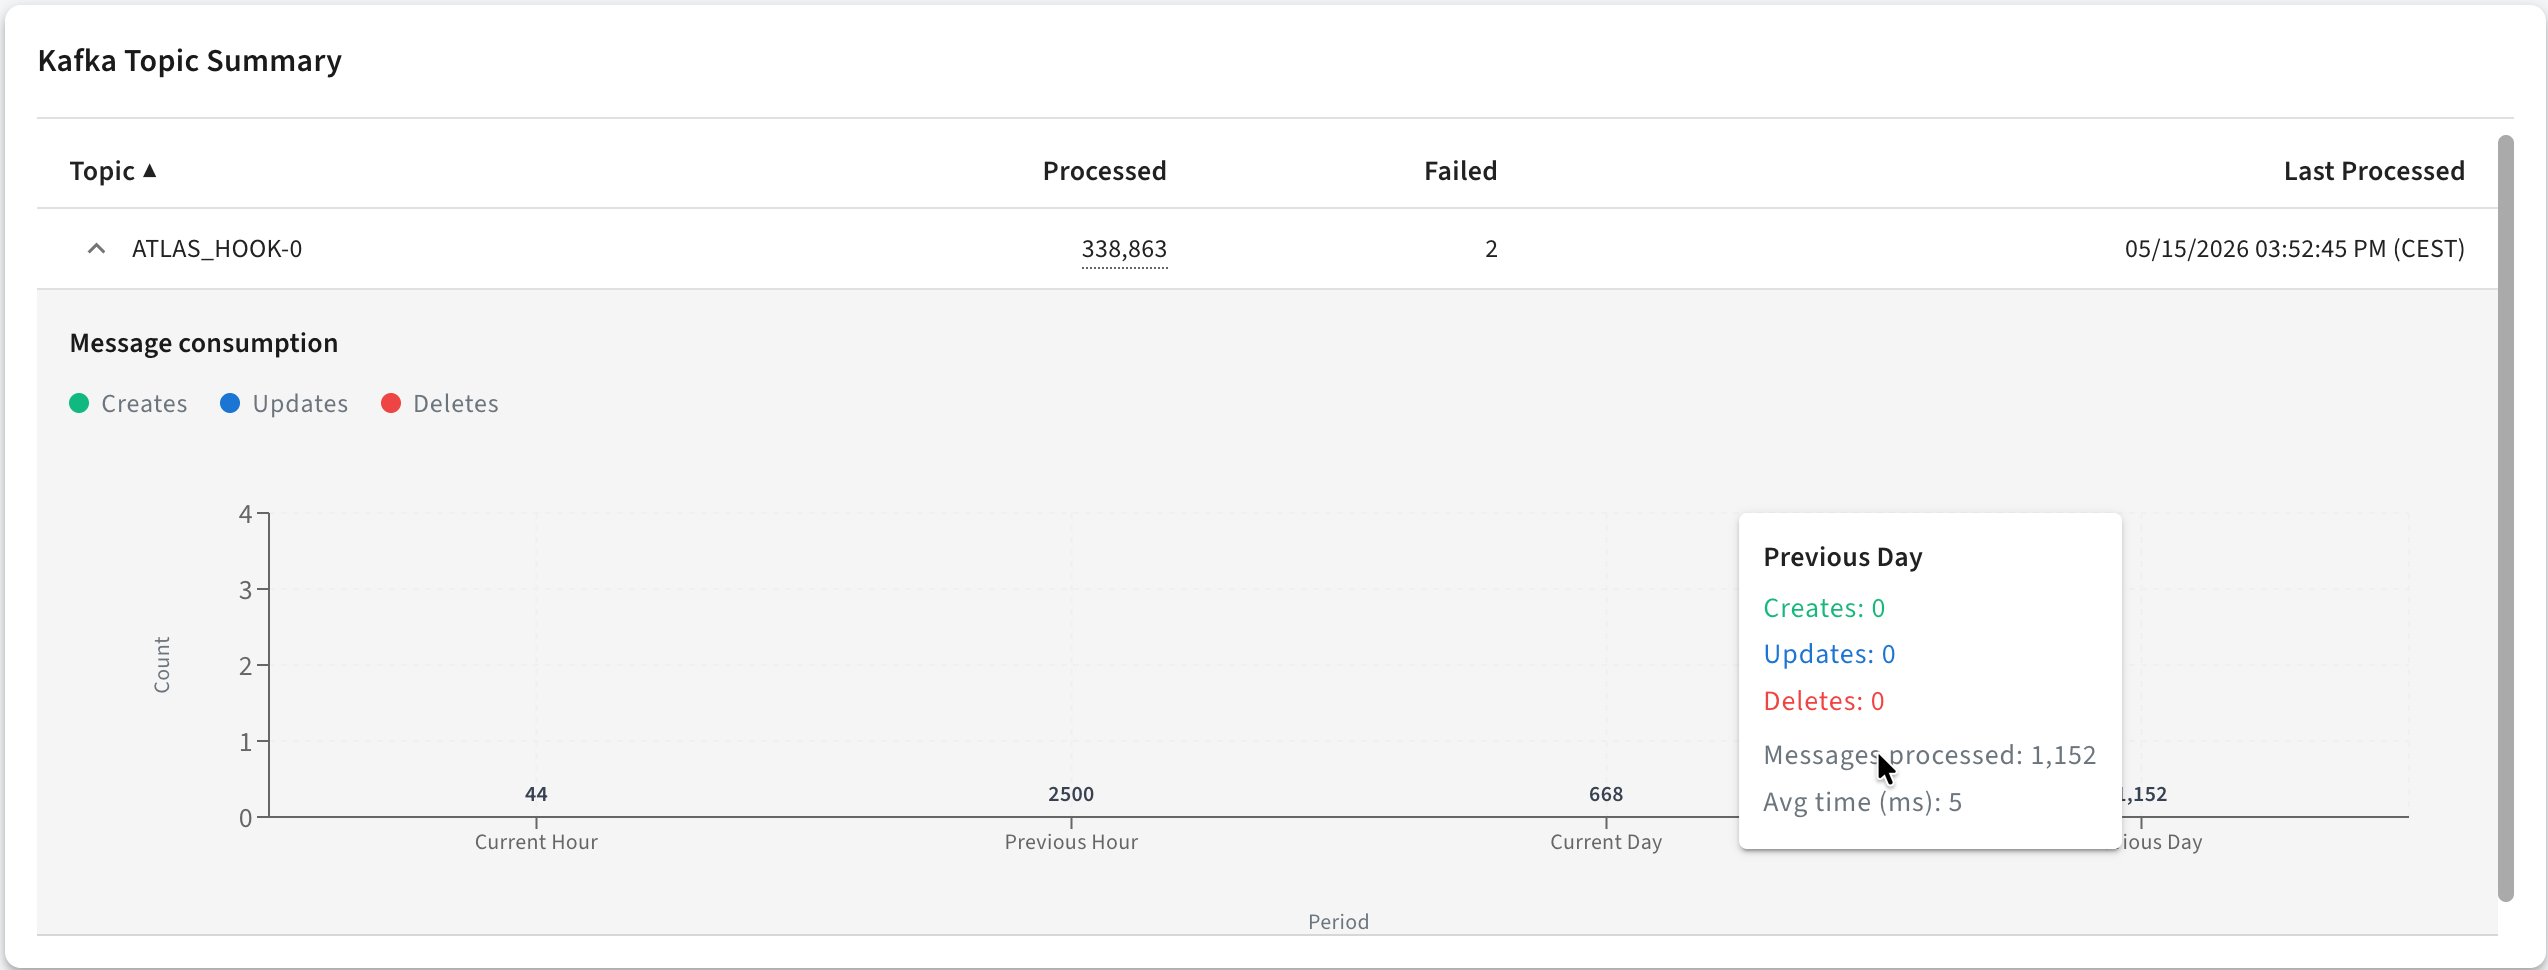
Global Search: Create and search
The top bar exposes the following actions:
- + Create opens a primary menu to start new entities, classifications, glossaries, business metadata definitions, and enums without navigating through nested panels first.
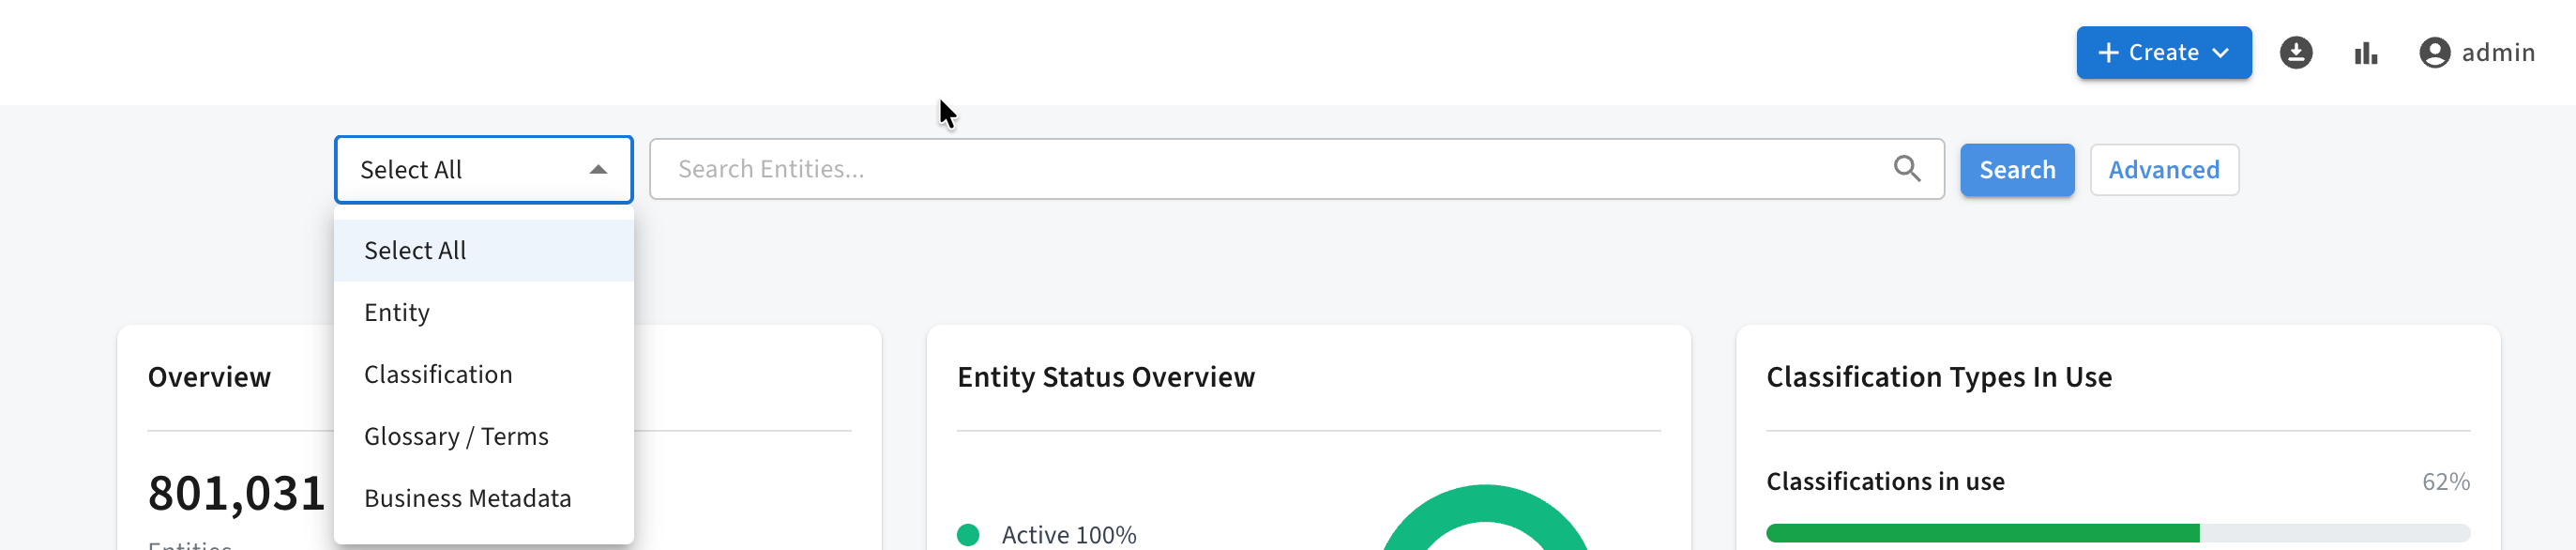
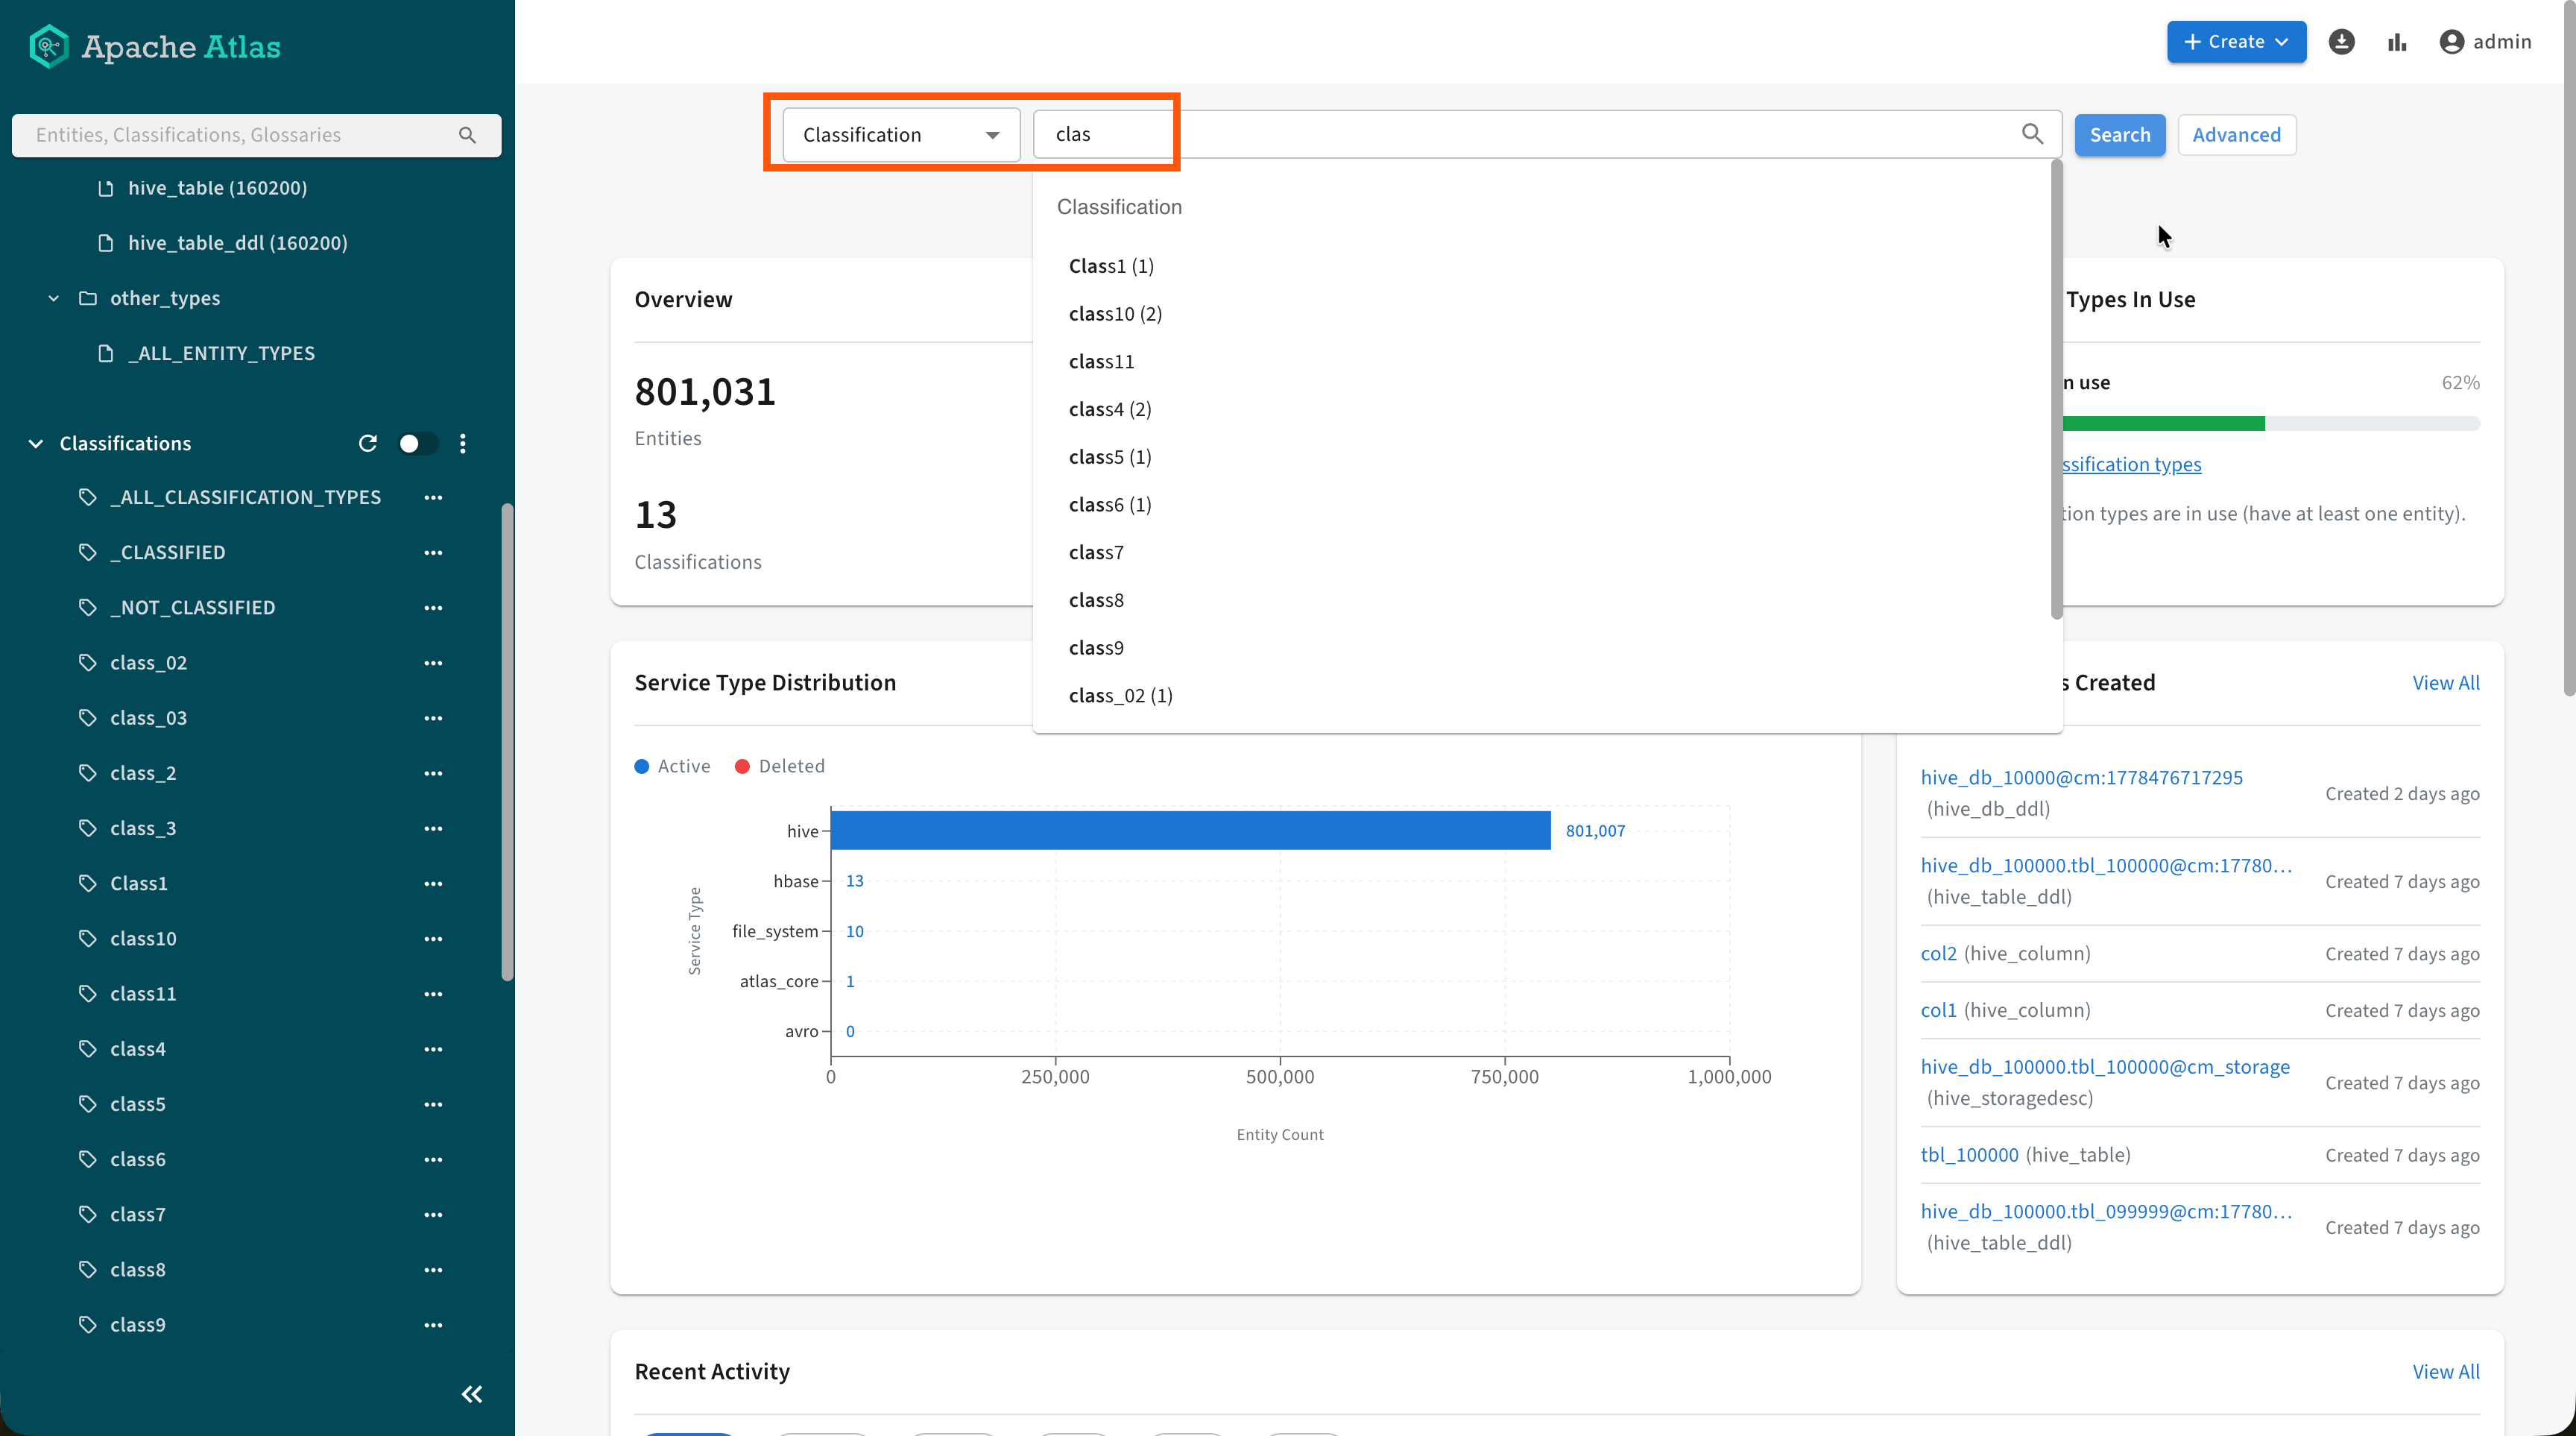
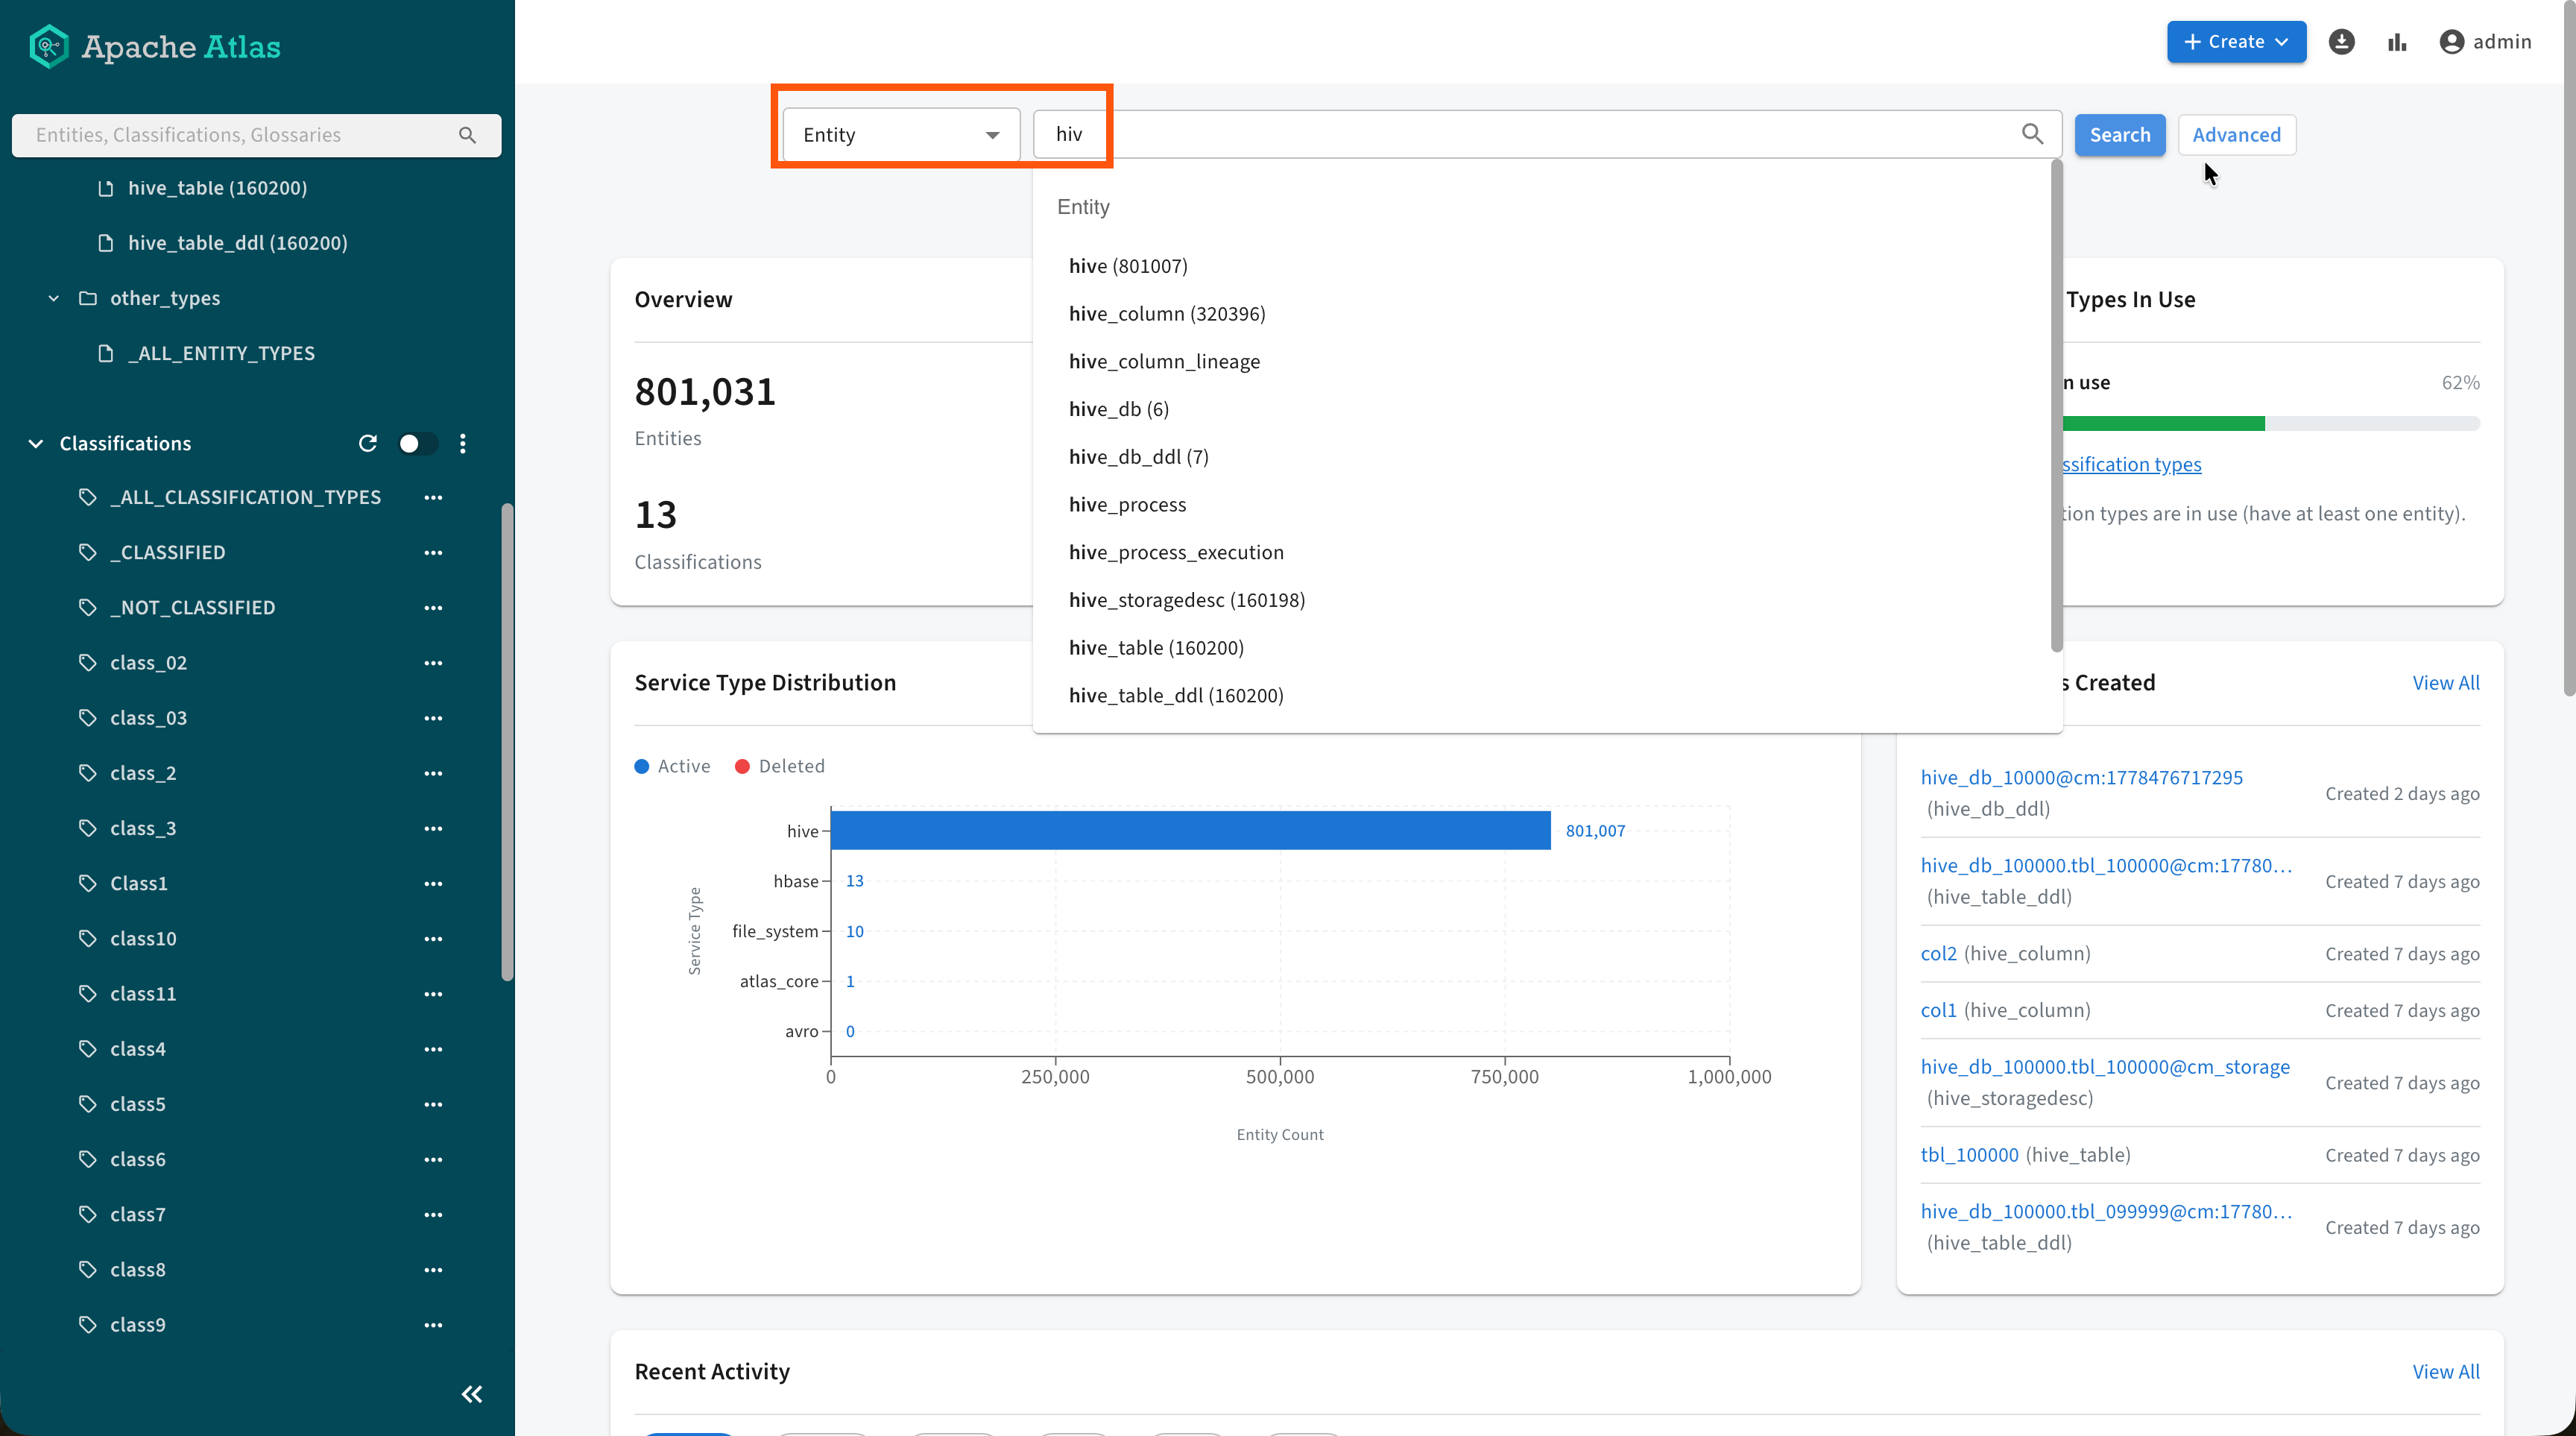
- Global Search performs quick lookups with contextual suggestions as you type. Select a scope from the drop-down list beside the field before or while you enter text so Atlas prioritizes matches for Entity, Classification, Glossary / Terms, or Business Metadata. The scoped mode provides suggestion lists as you type and narrows the results relevant to that metadata category.
Basic Search
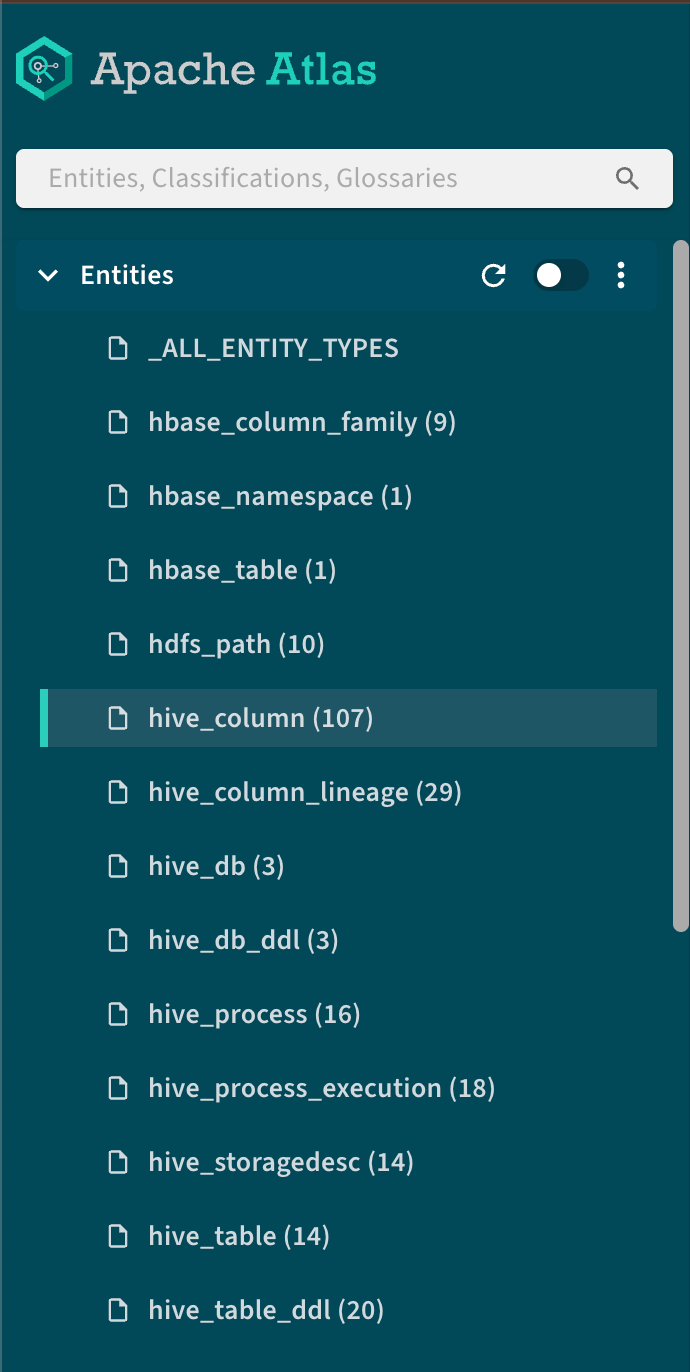
The new Basic Search panel automatically lists all available entity types, classifications and glossary terms. Clicking an item in one of the categories automatically lists all relevant members.
The Atlas UI includes radio buttons that enable the following filtering options:
- Entities Displays empty service types
- Classifications Displays unused classifications
- Glossary Displays category or terms
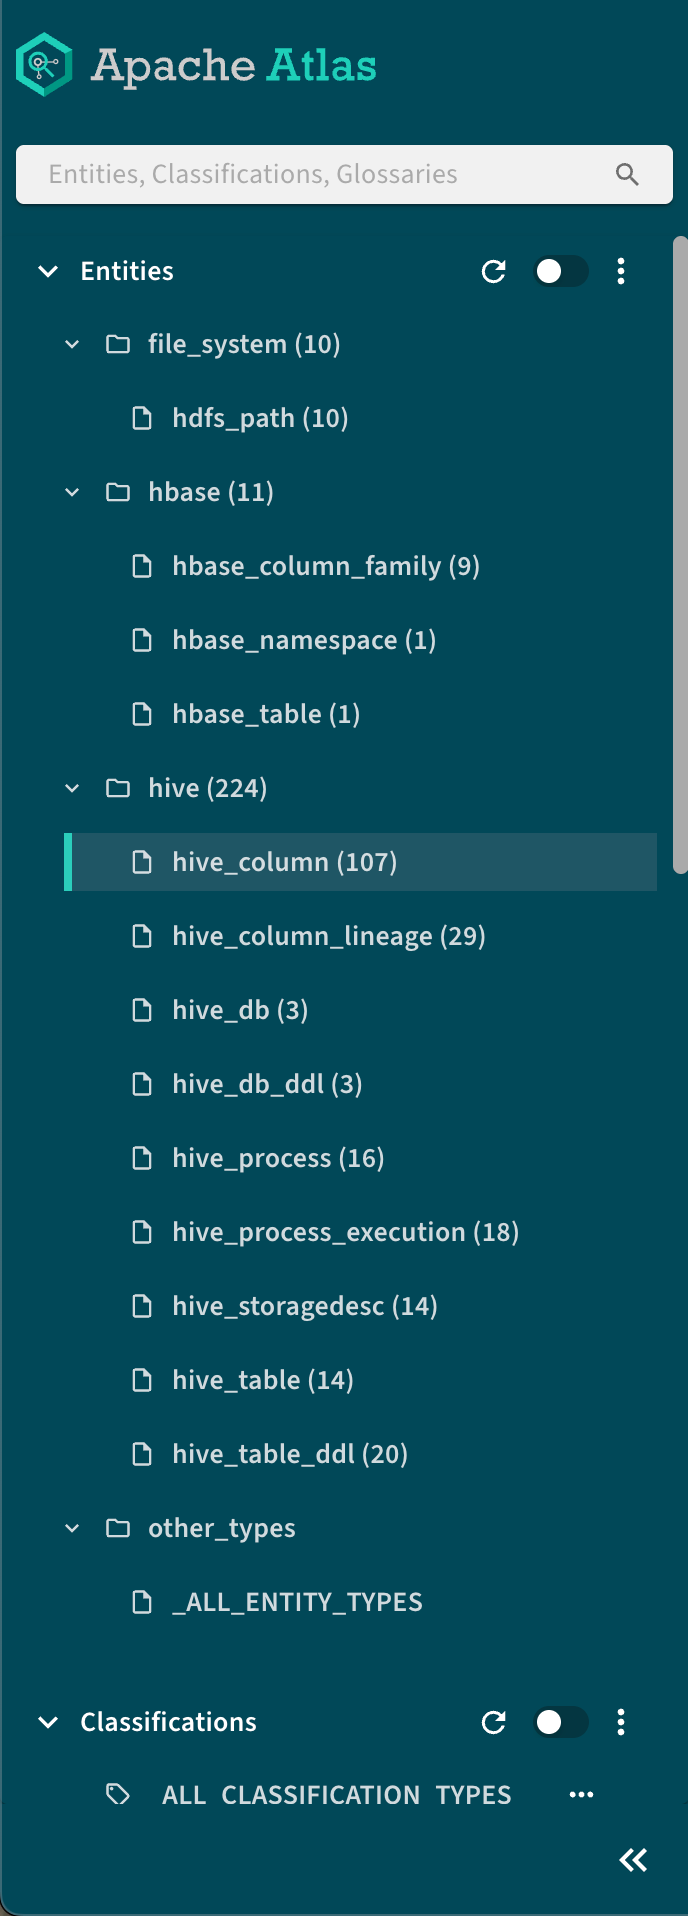
Entities and classifications can be collapsed to a flat tree, by clicking  >
>  Show flat tree.
- SEARCH
Enables filtering by metadata type or running custom Atlas DSL search queries. Both Basic and Advanced searches can be saved for easy reuse in Favorite Searches.
- CLASSIFICATION
Provides access to predefined searches based on classifications.
- GLOSSARY
Enables searching using predefined glossary terms.
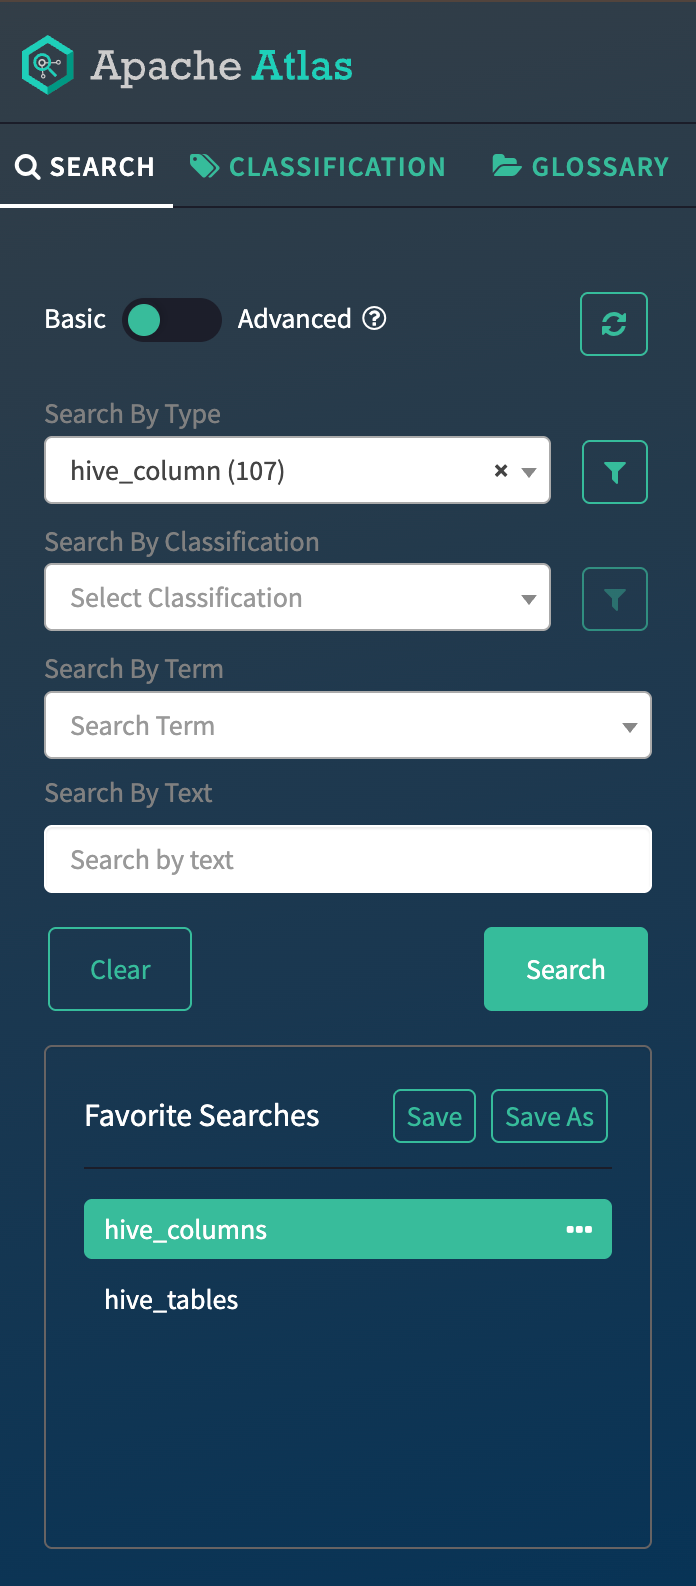
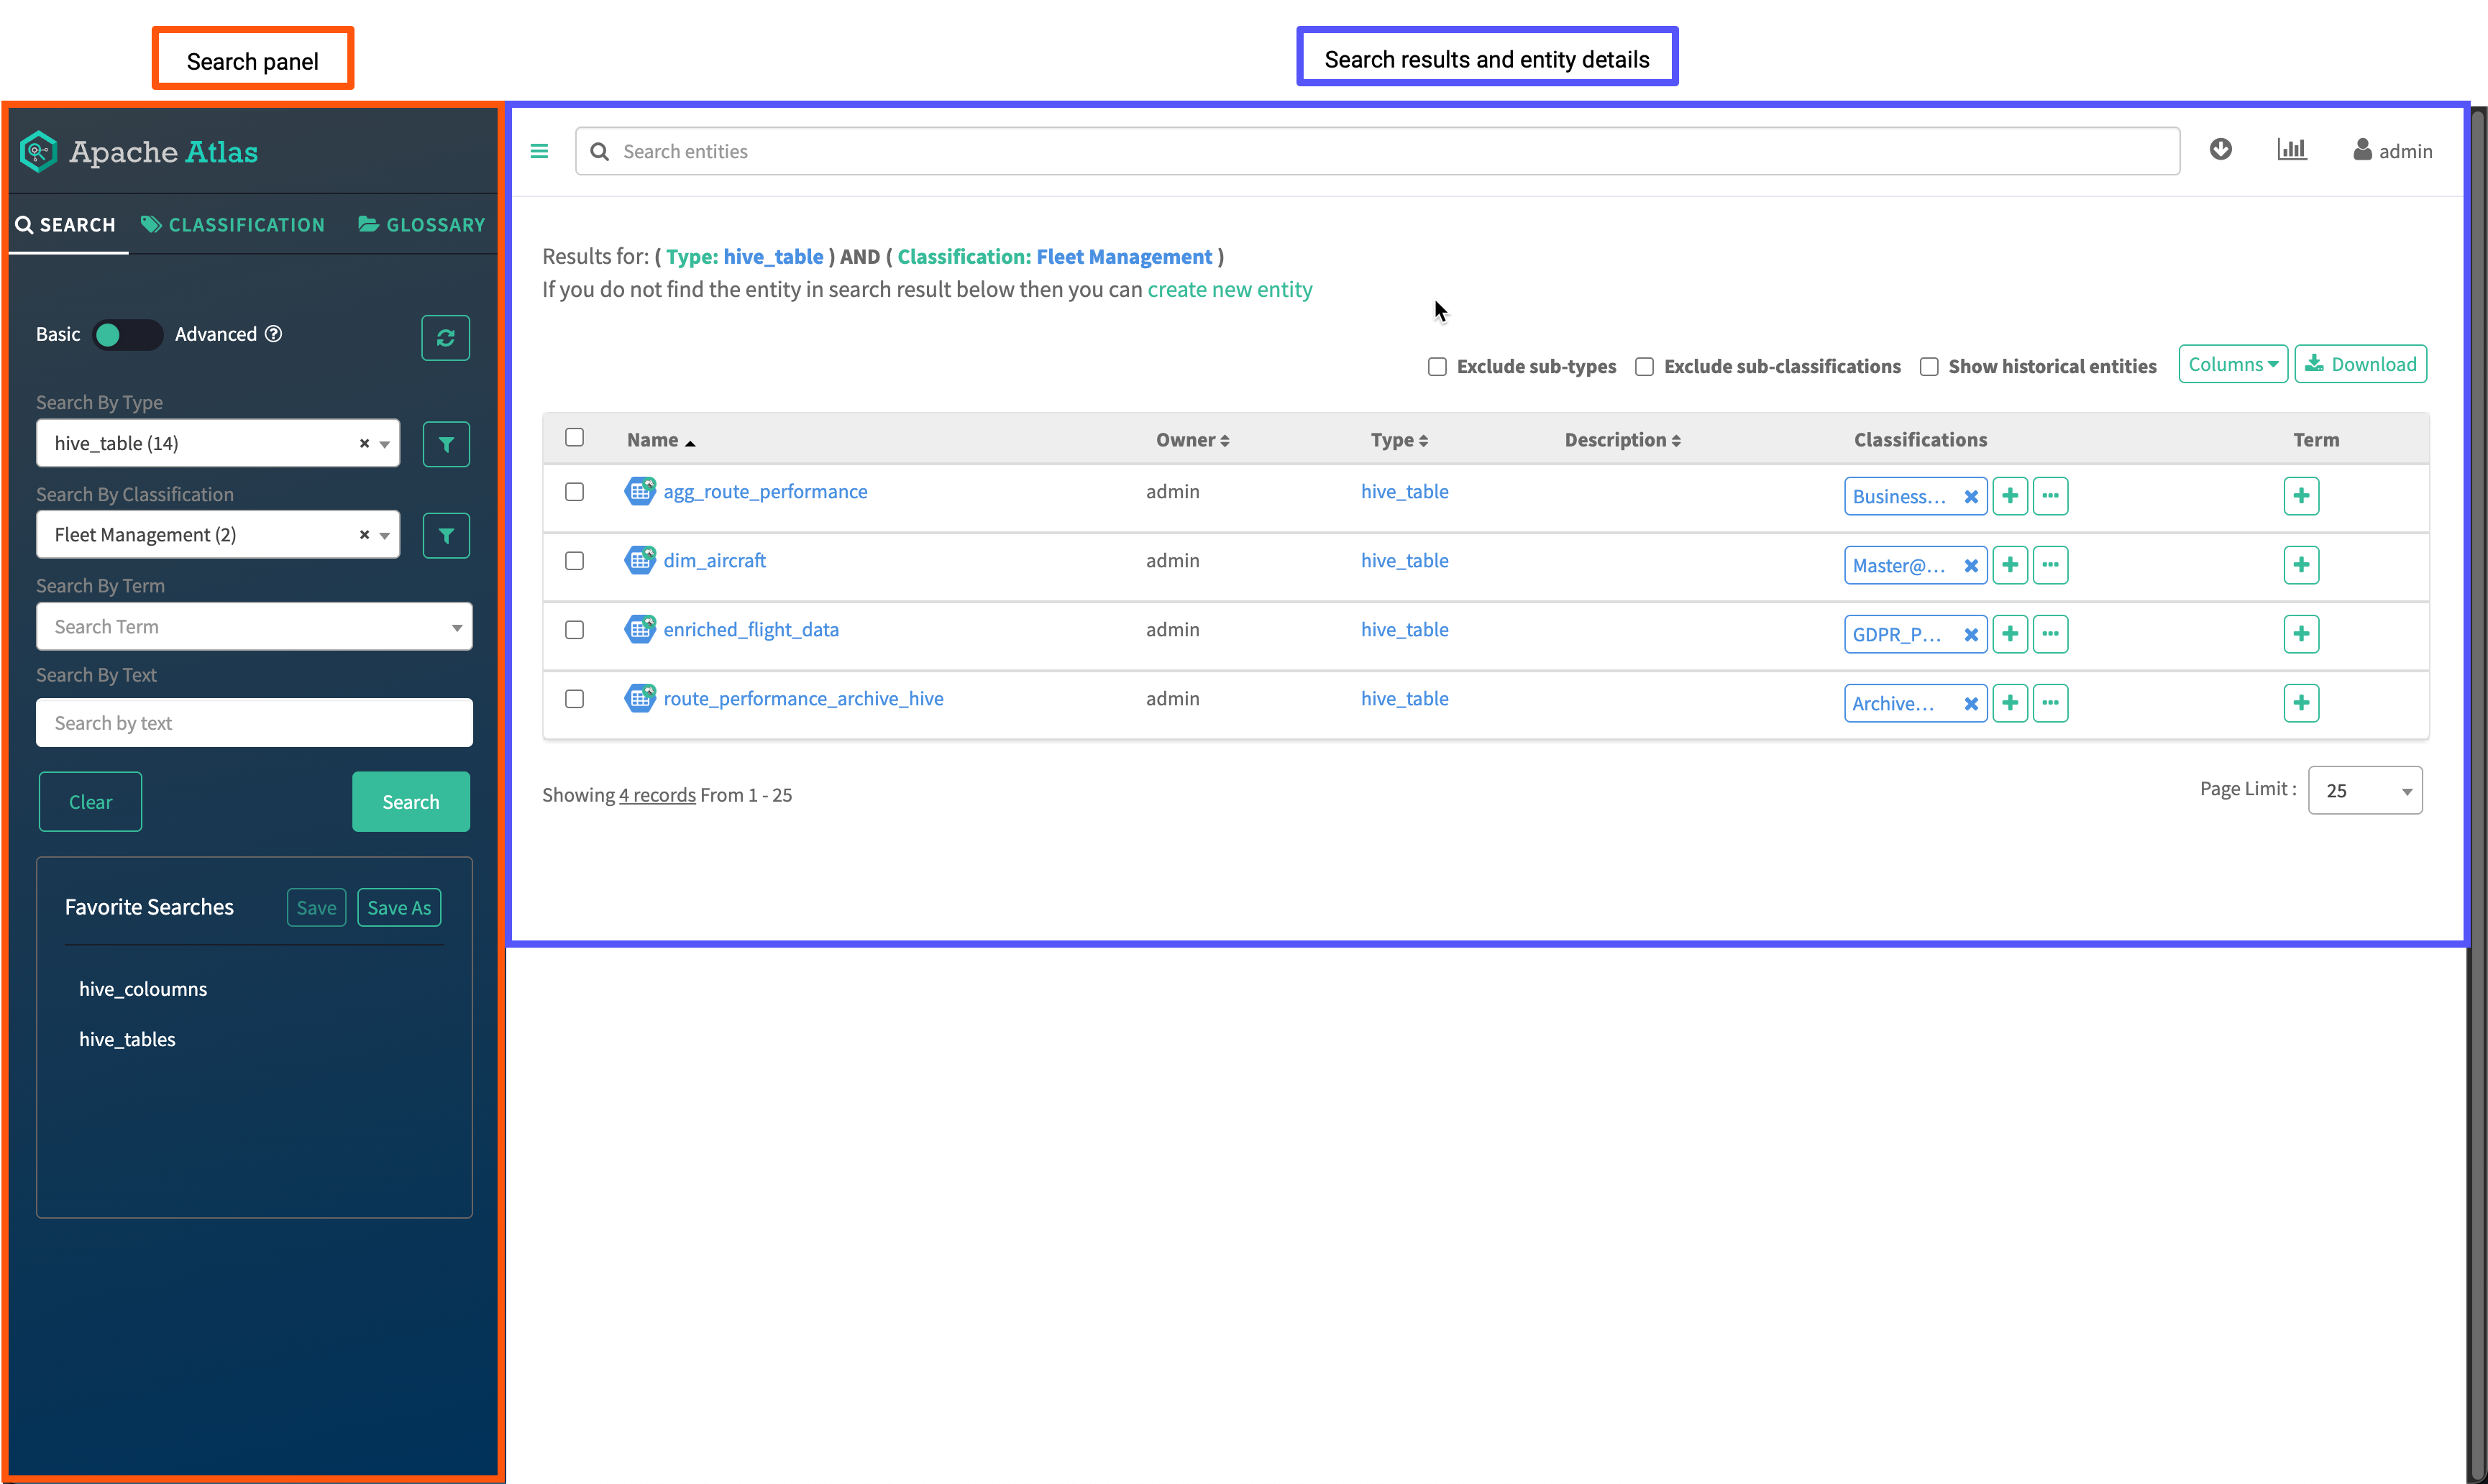
In the Classic UI, creation shortcuts and search remain anchored in the left SEARCH, CLASSIFICATION, and GLOSSARY tabs rather than in a consolidated header menu.
Classifications
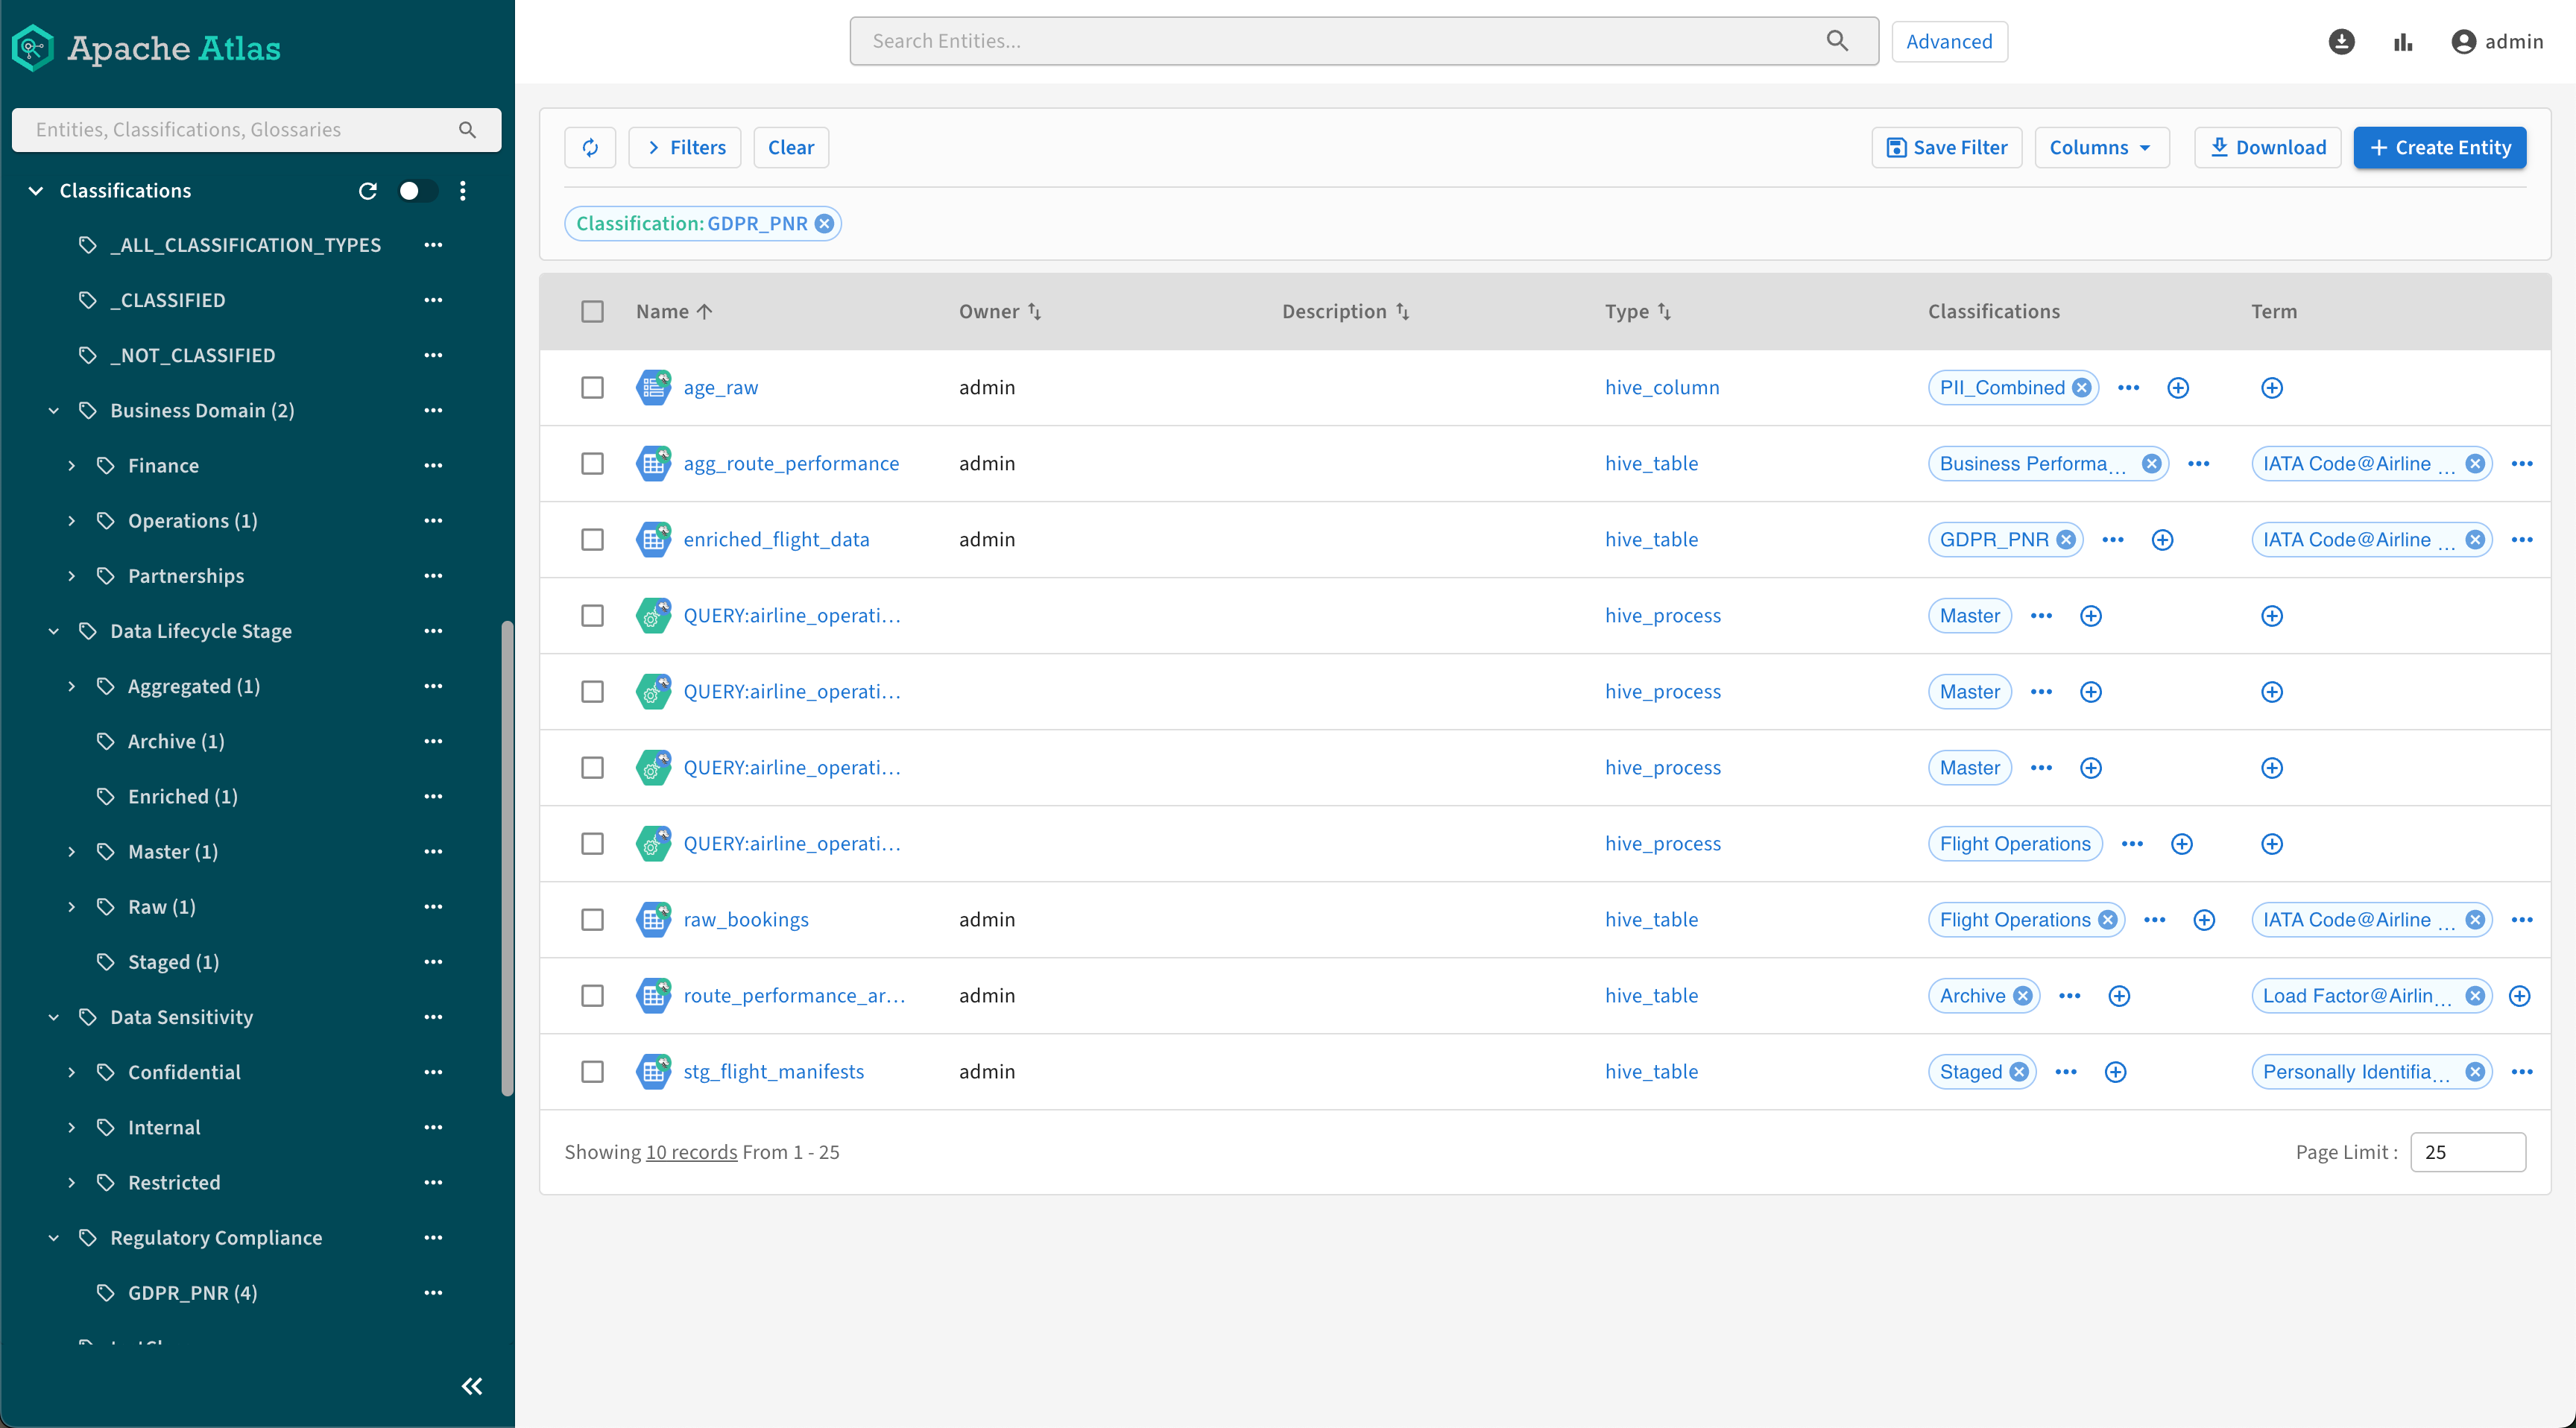
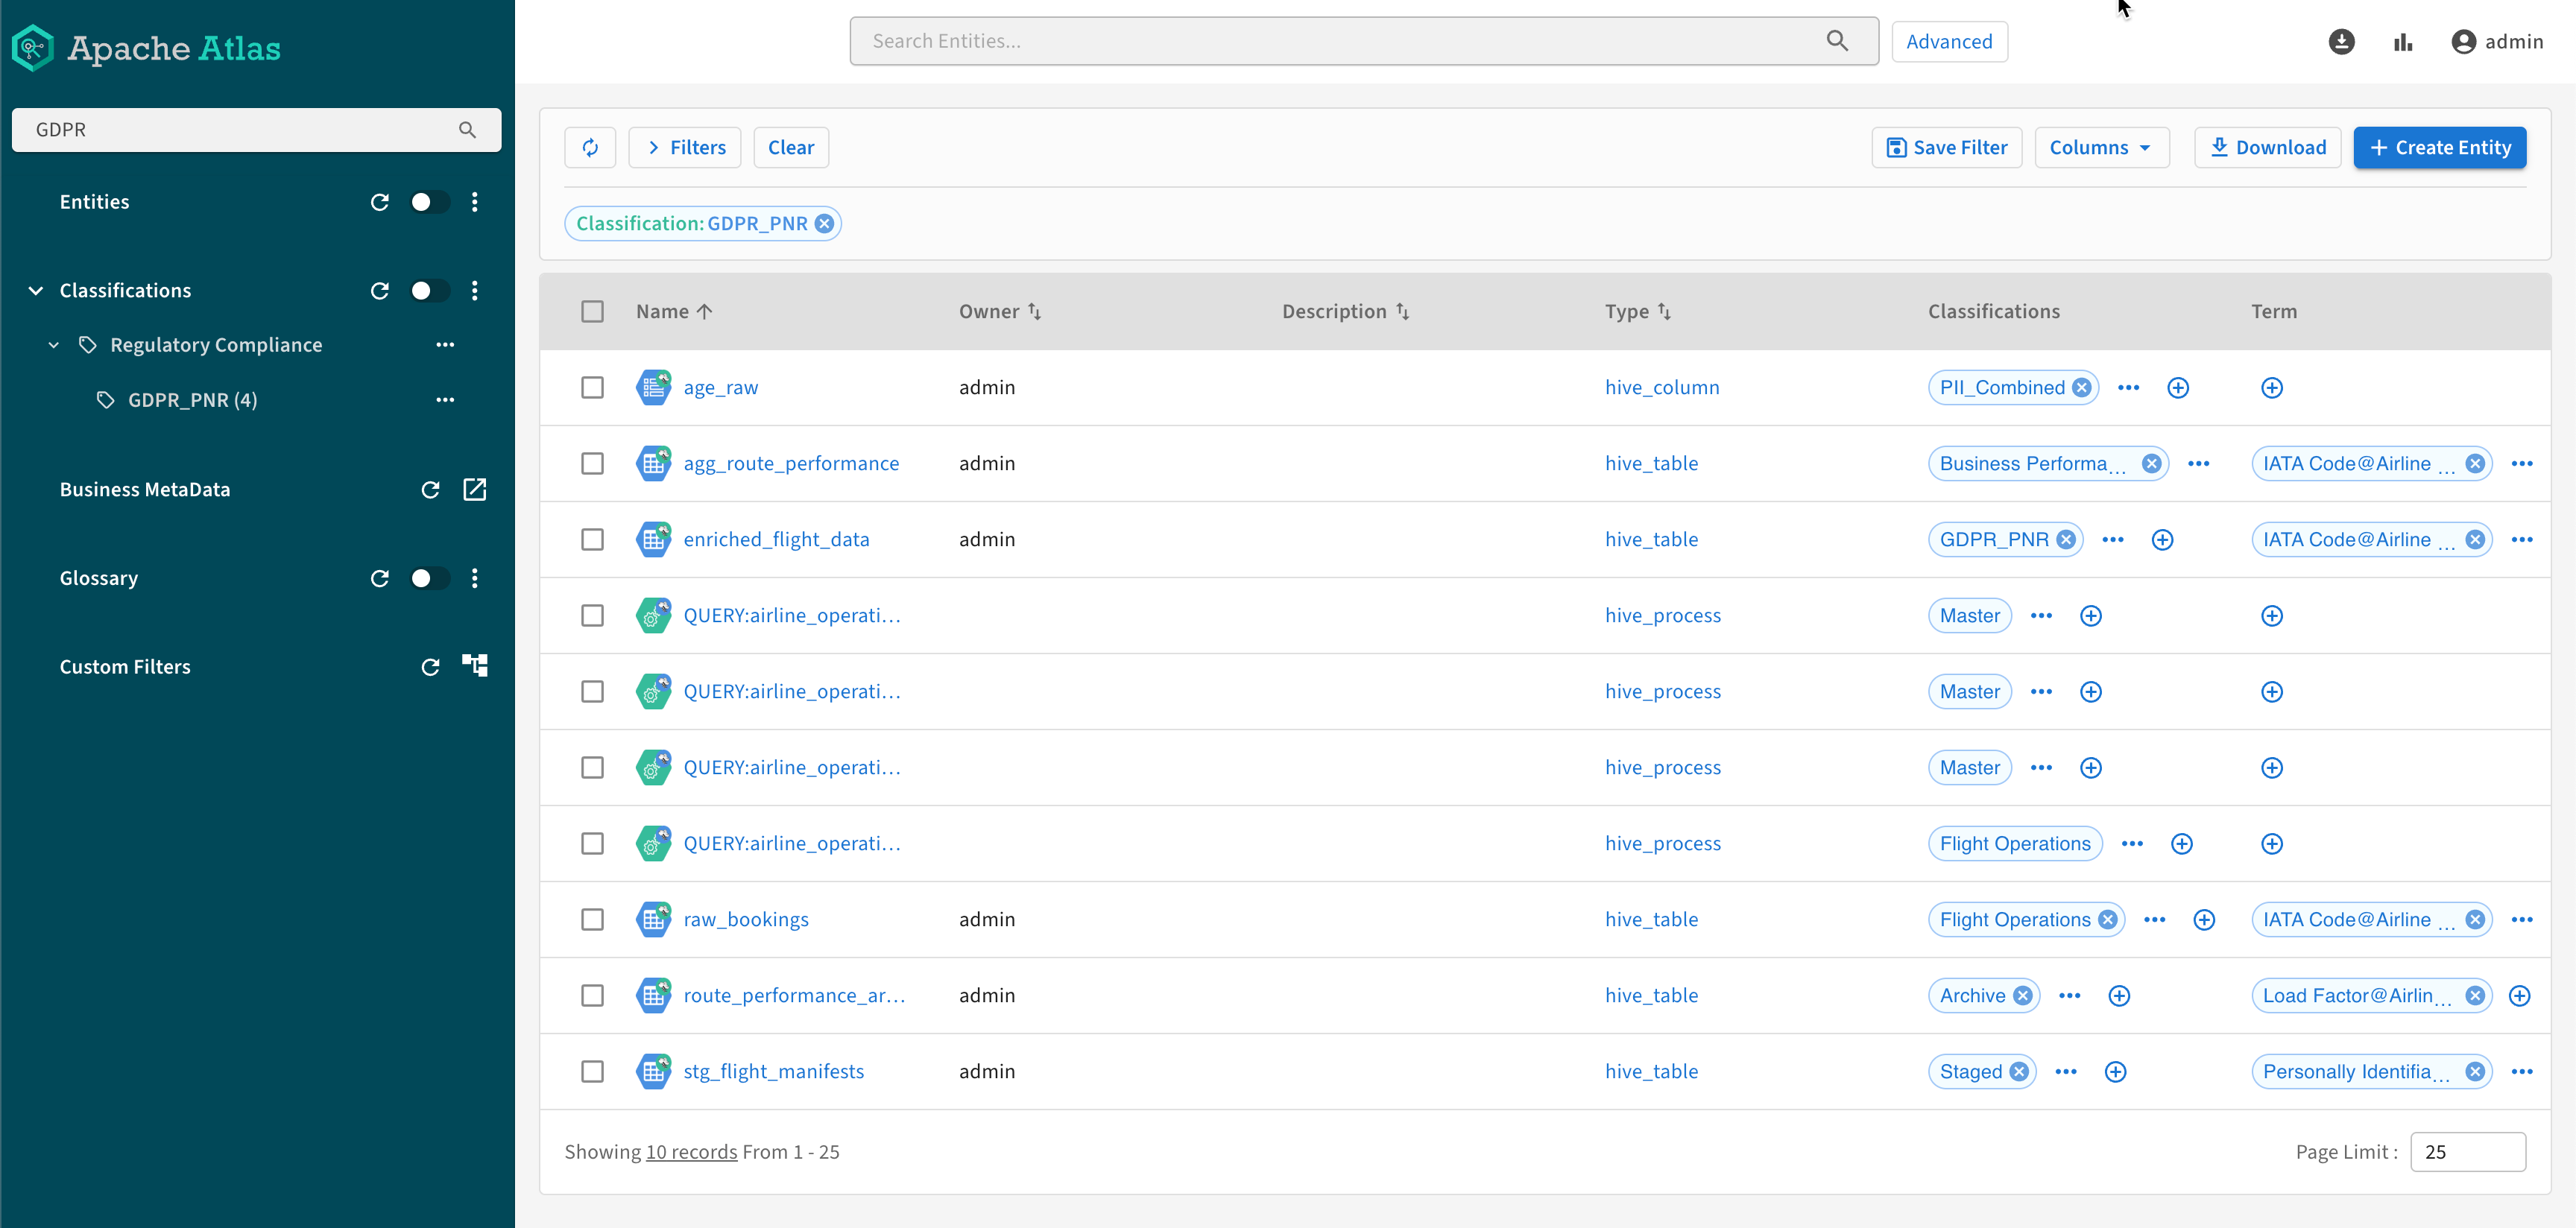
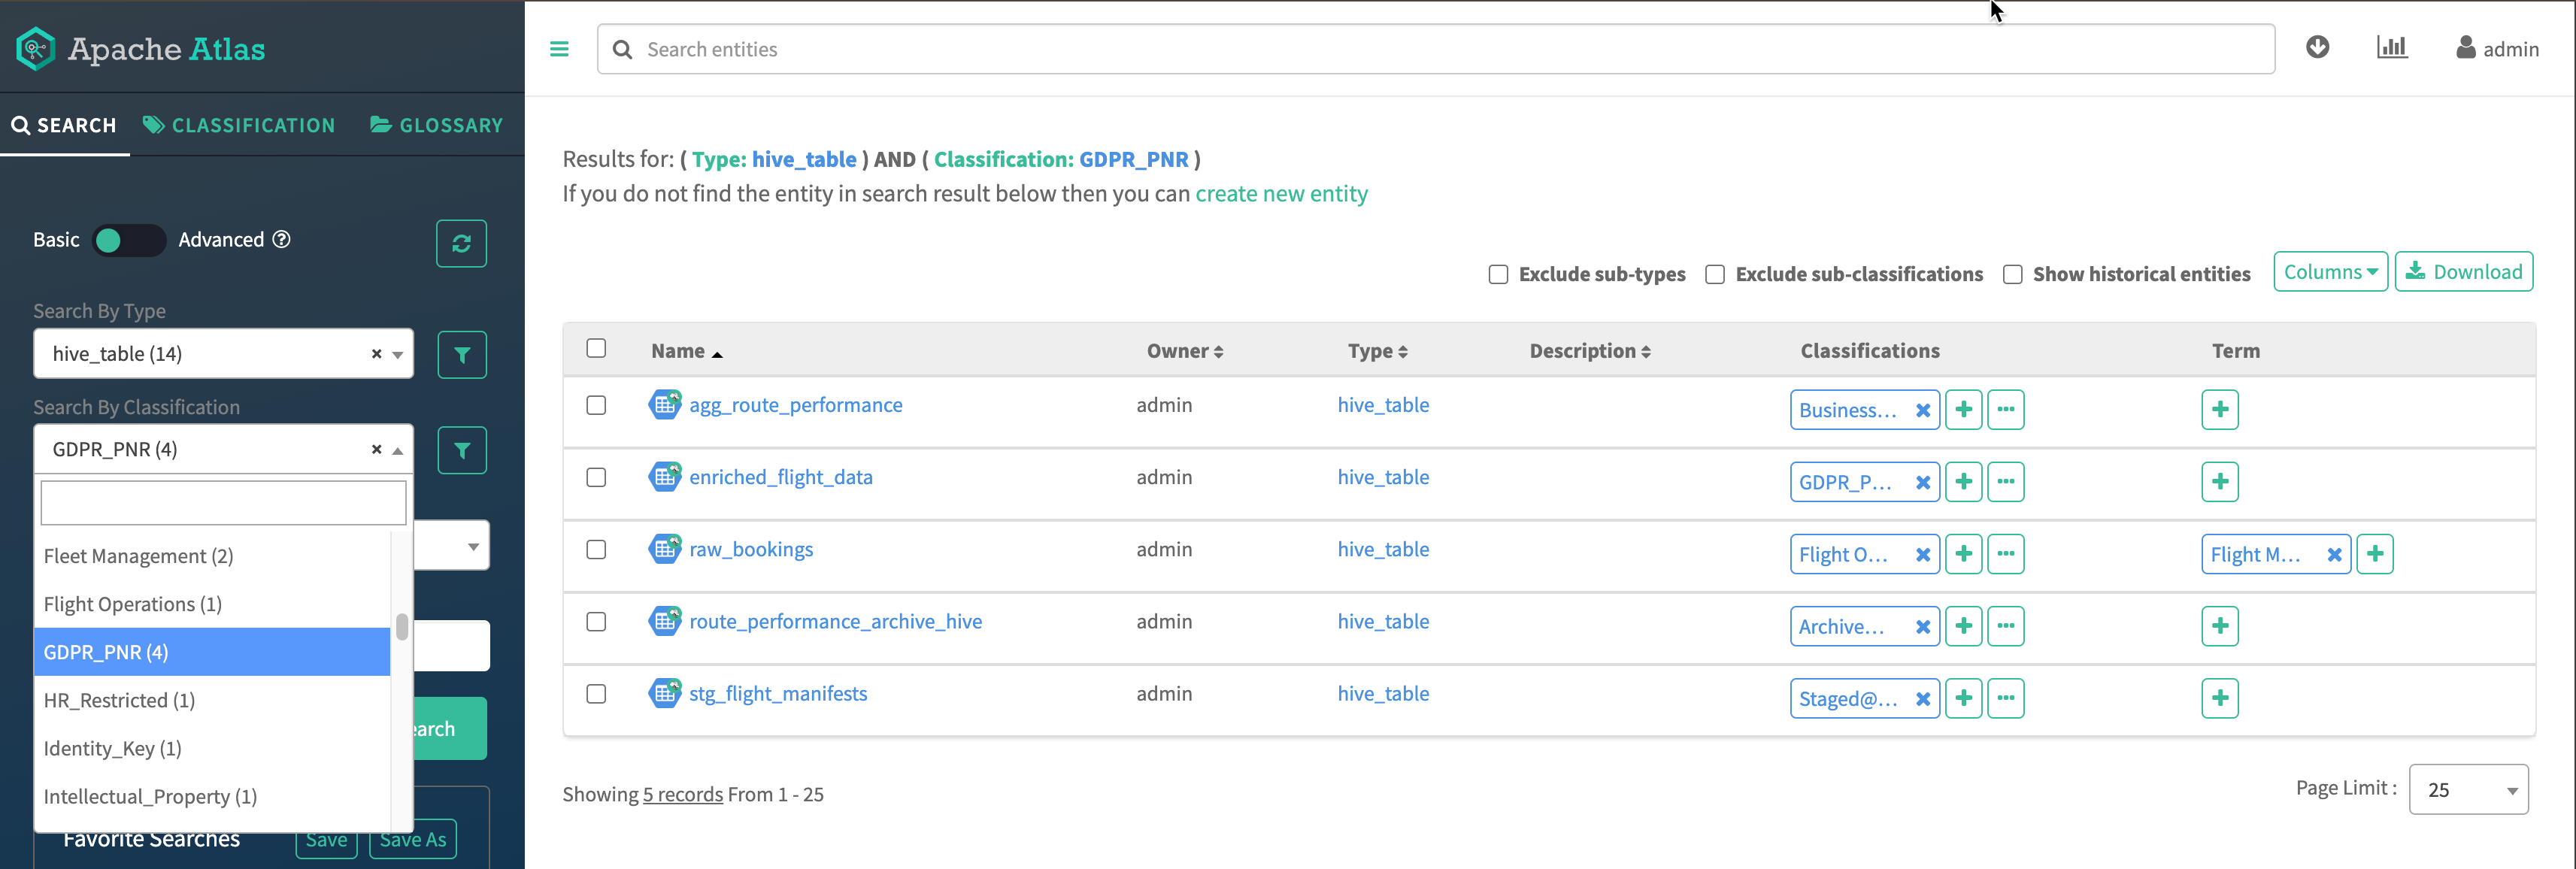
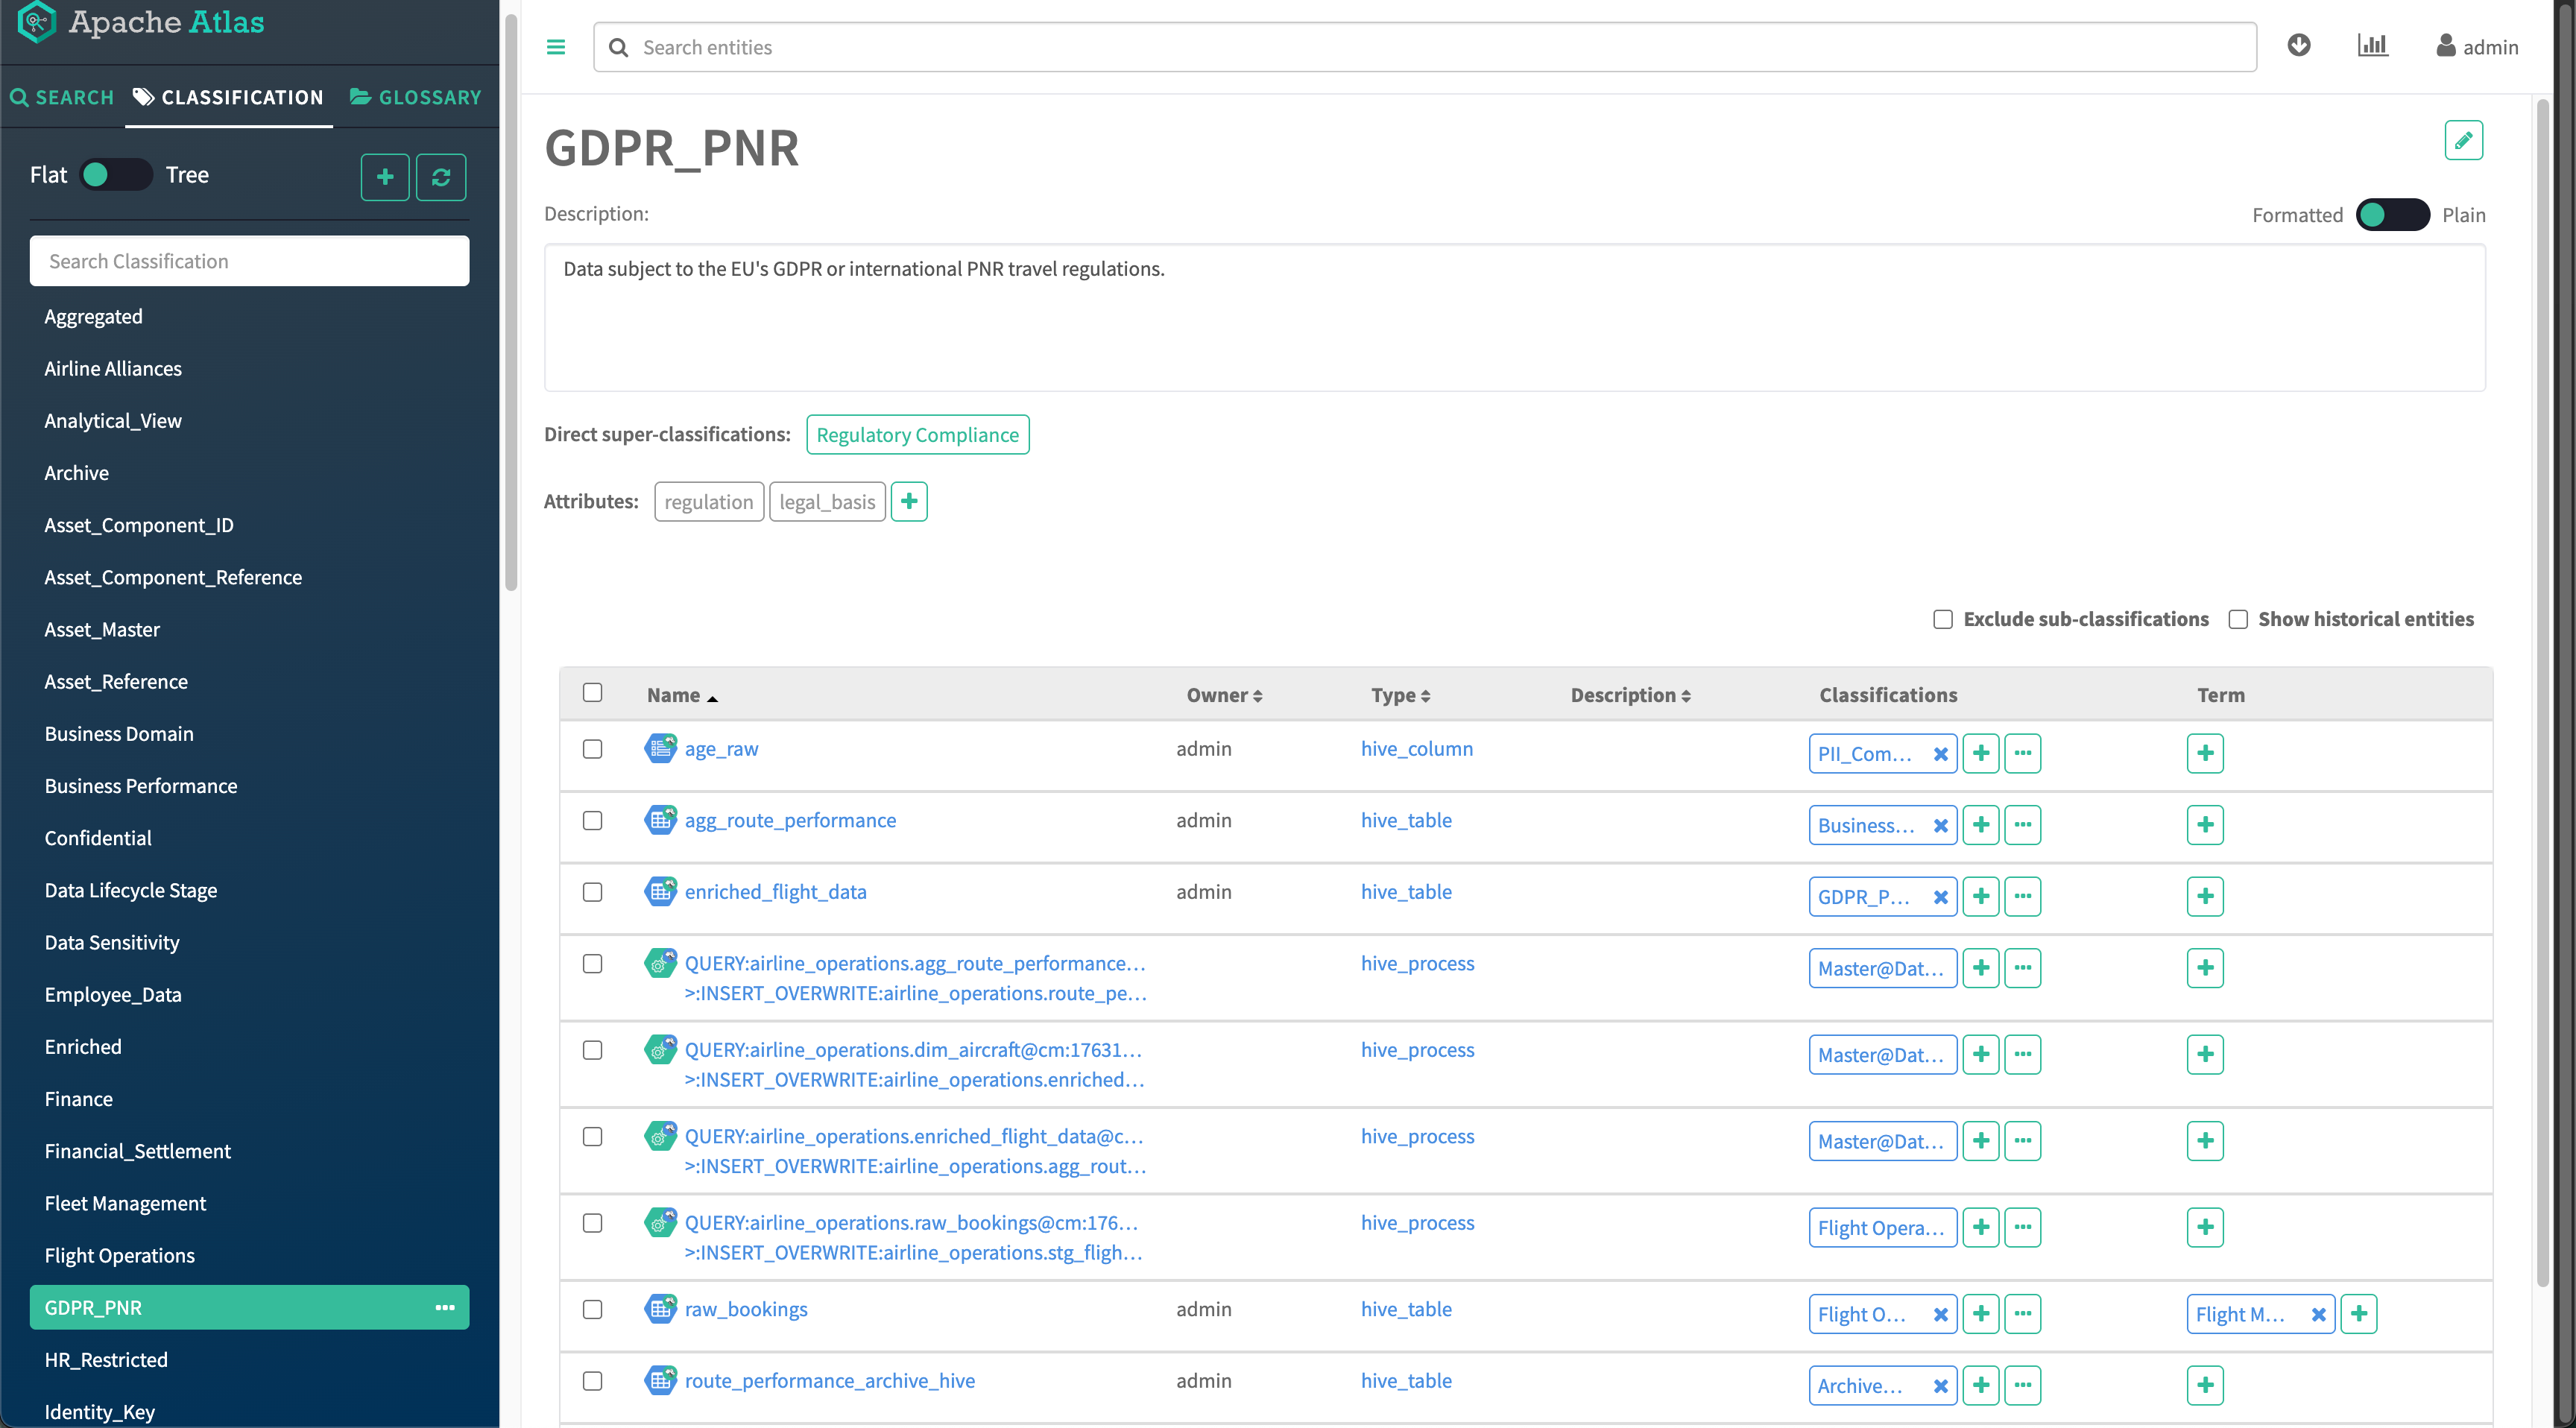
Selecting a classification displays all the entities that are marked with that classification. You can locate a specific classification using the search box or browsing the classification hierarchy that you defined during classification creation. Search results display all matching assets, including processes.
Glossary
Selecting a glossary term displays all the entities that are marked with that term. You can locate a specific term using the search box or browsing terms by glossary. Use the category view to navigate the hierarchy of your organization’s business glossary. Selecting a category displays its assigned terms in the display pane. When you select one of those terms, Atlas displays the associated entities.
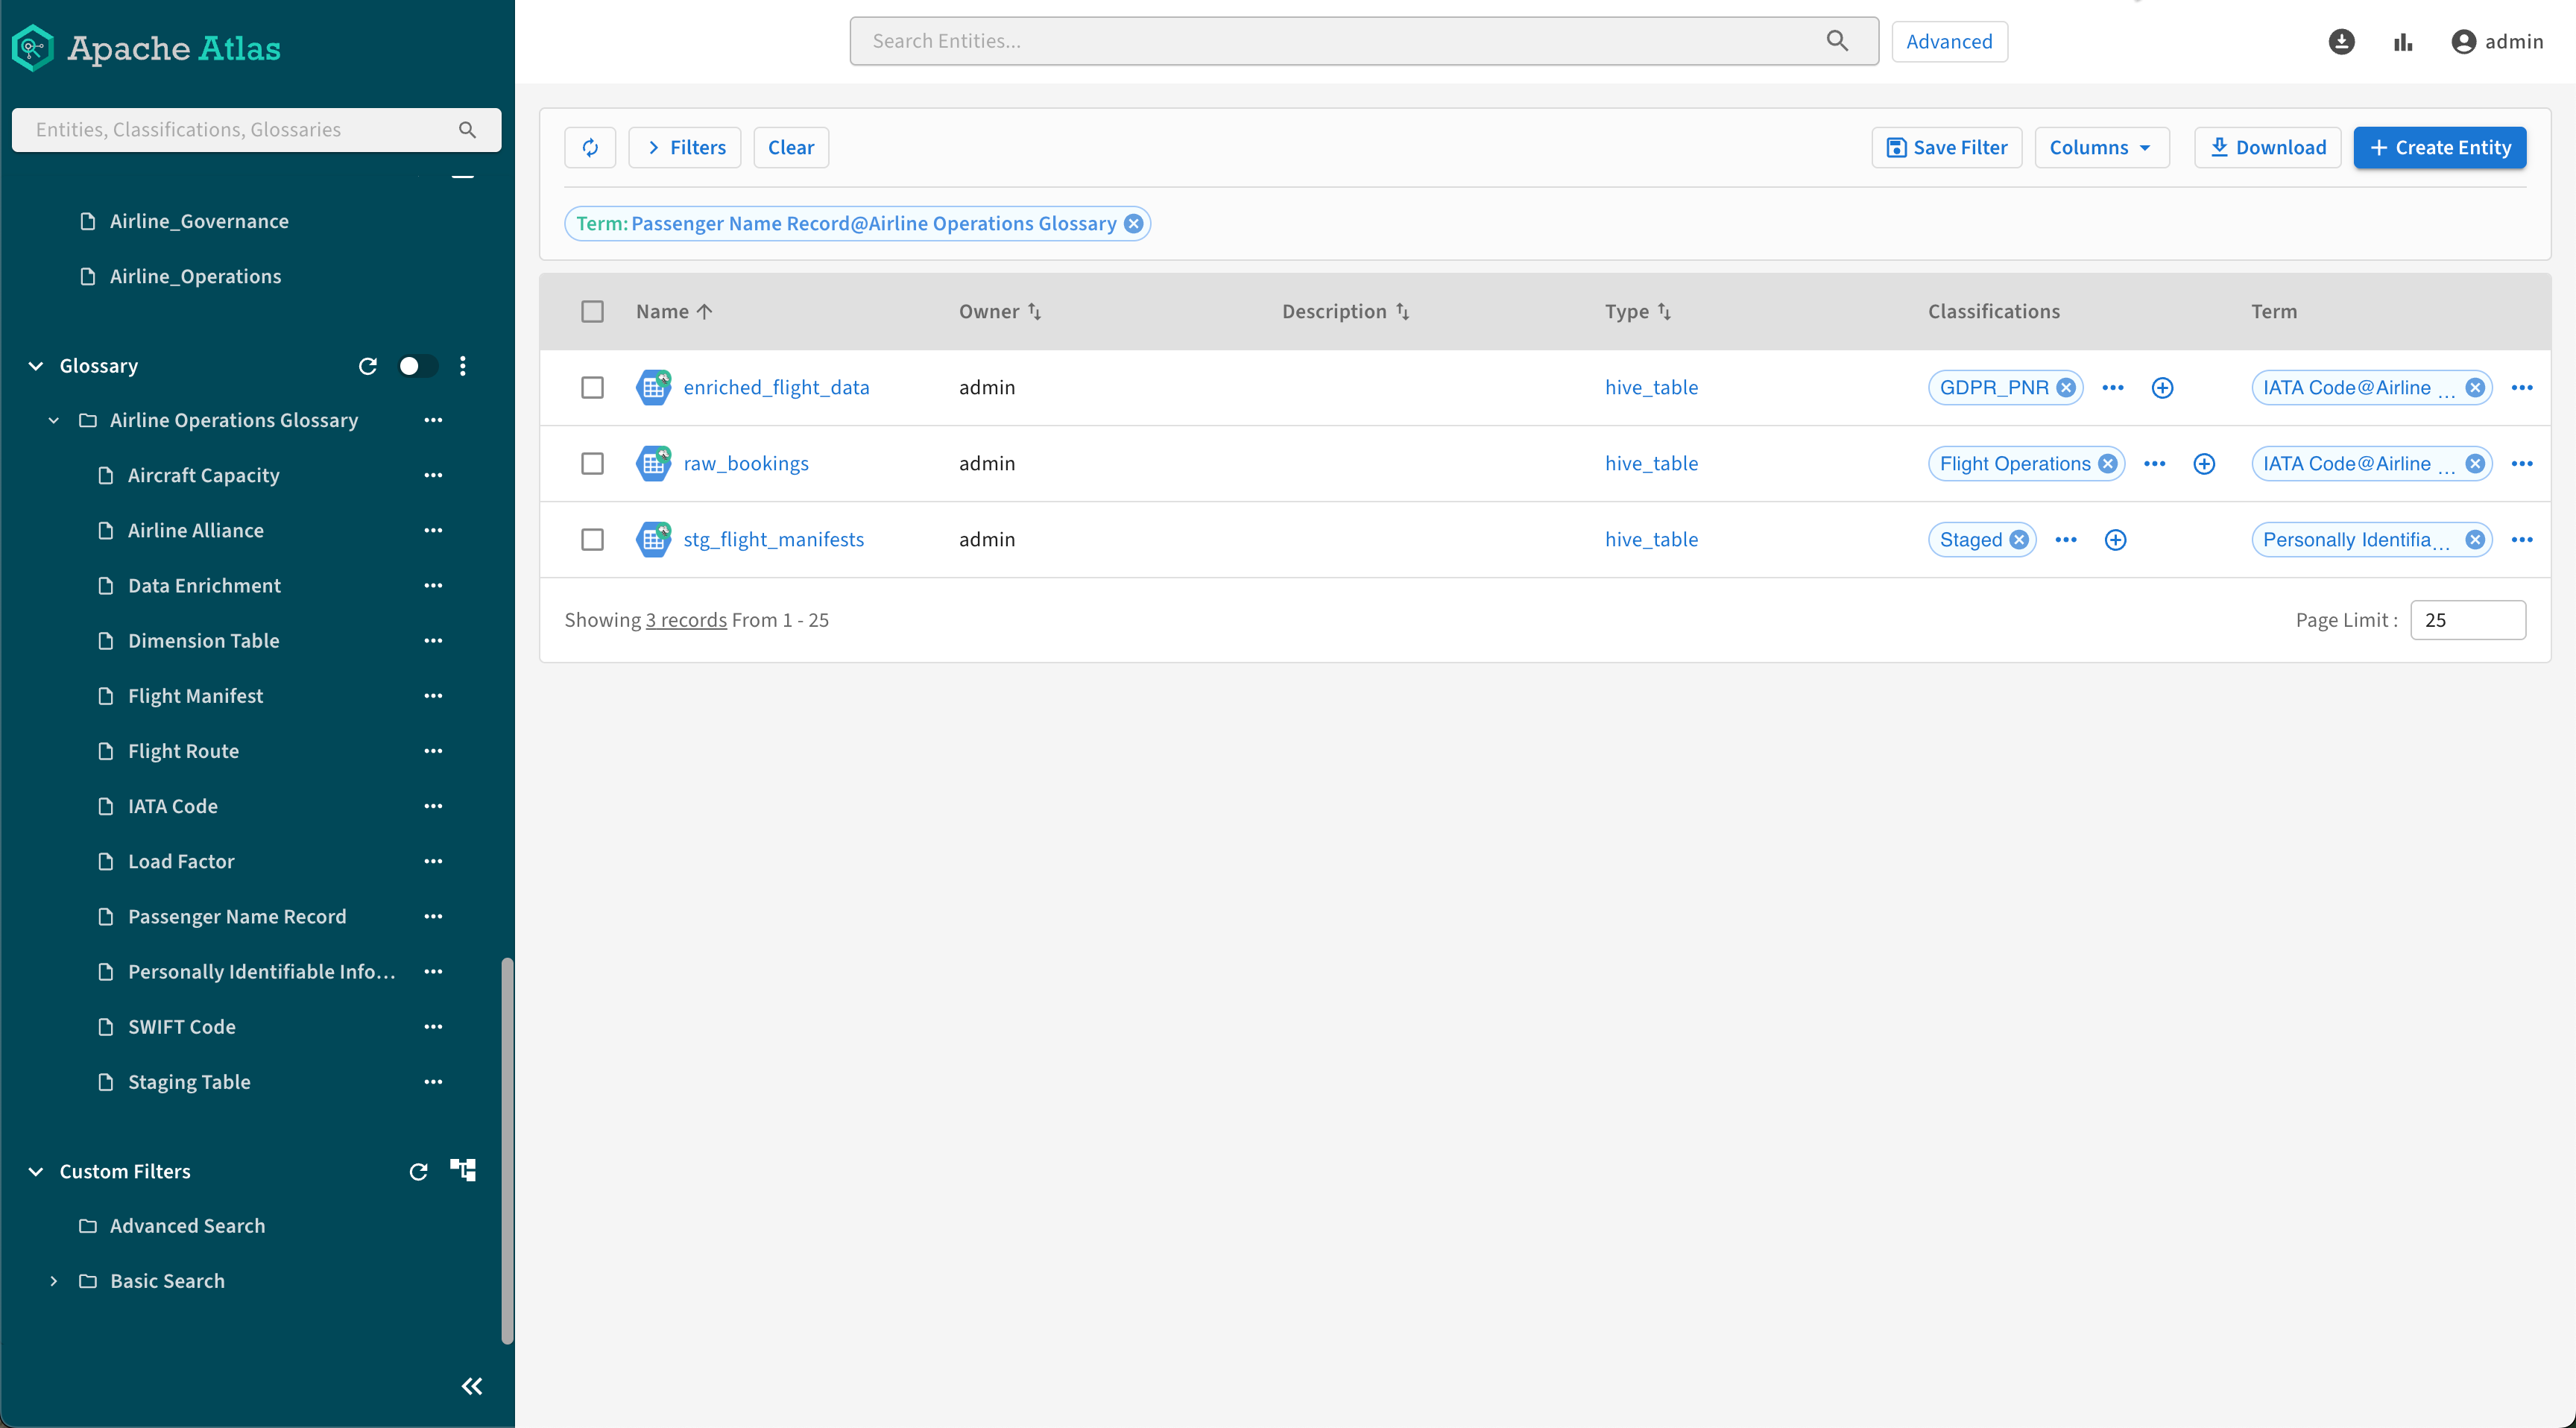
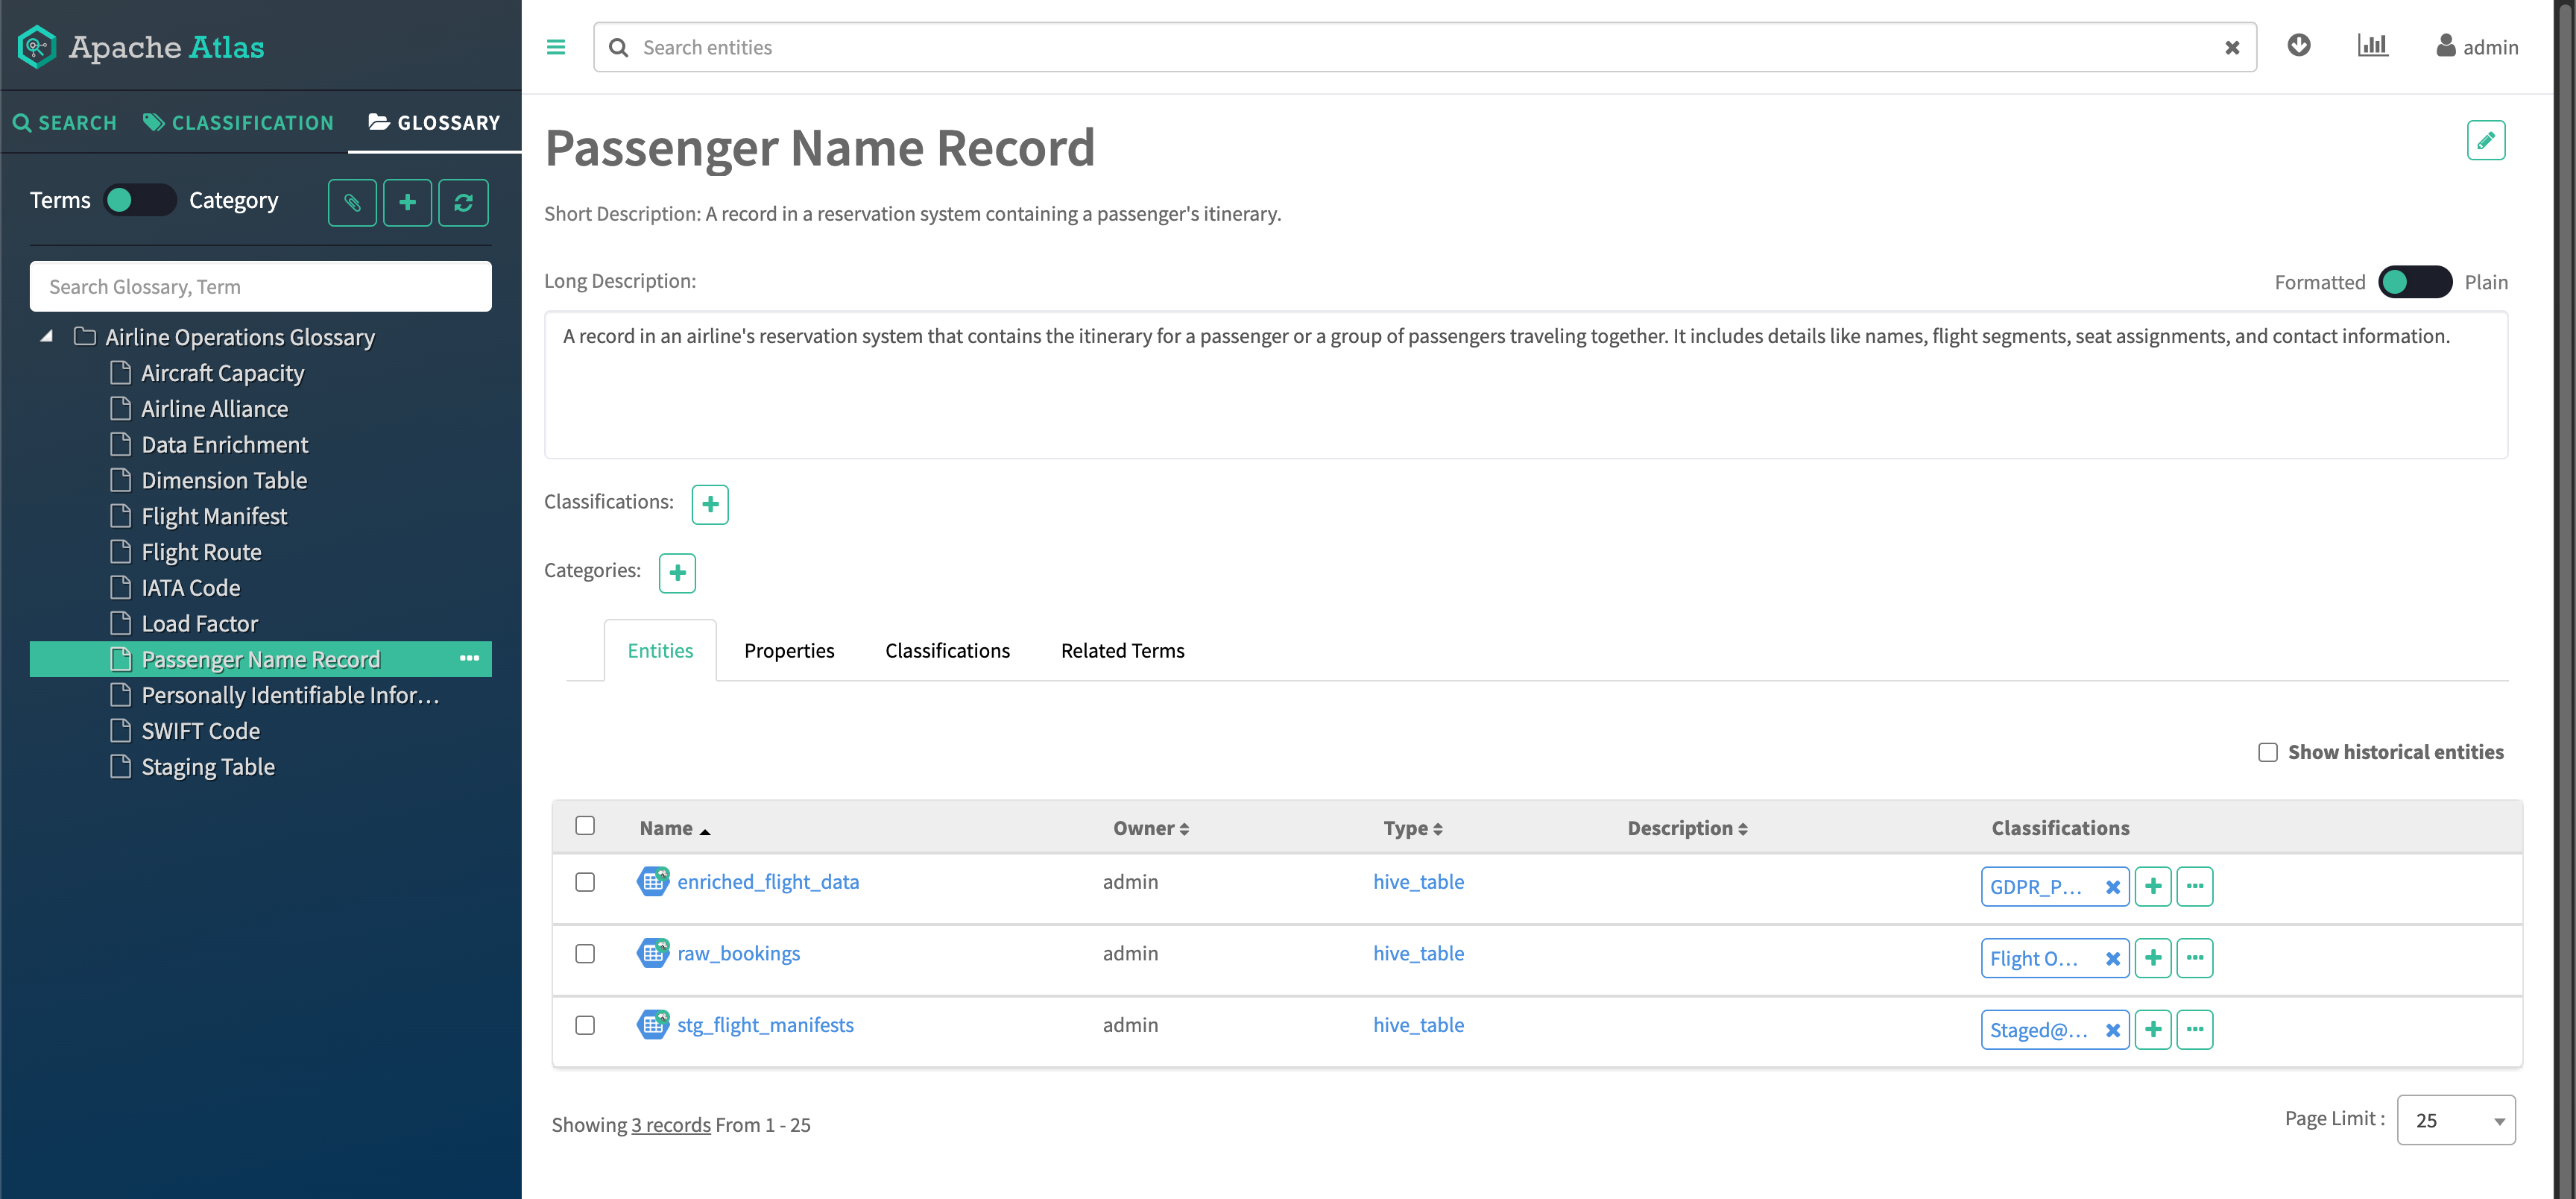
Search results
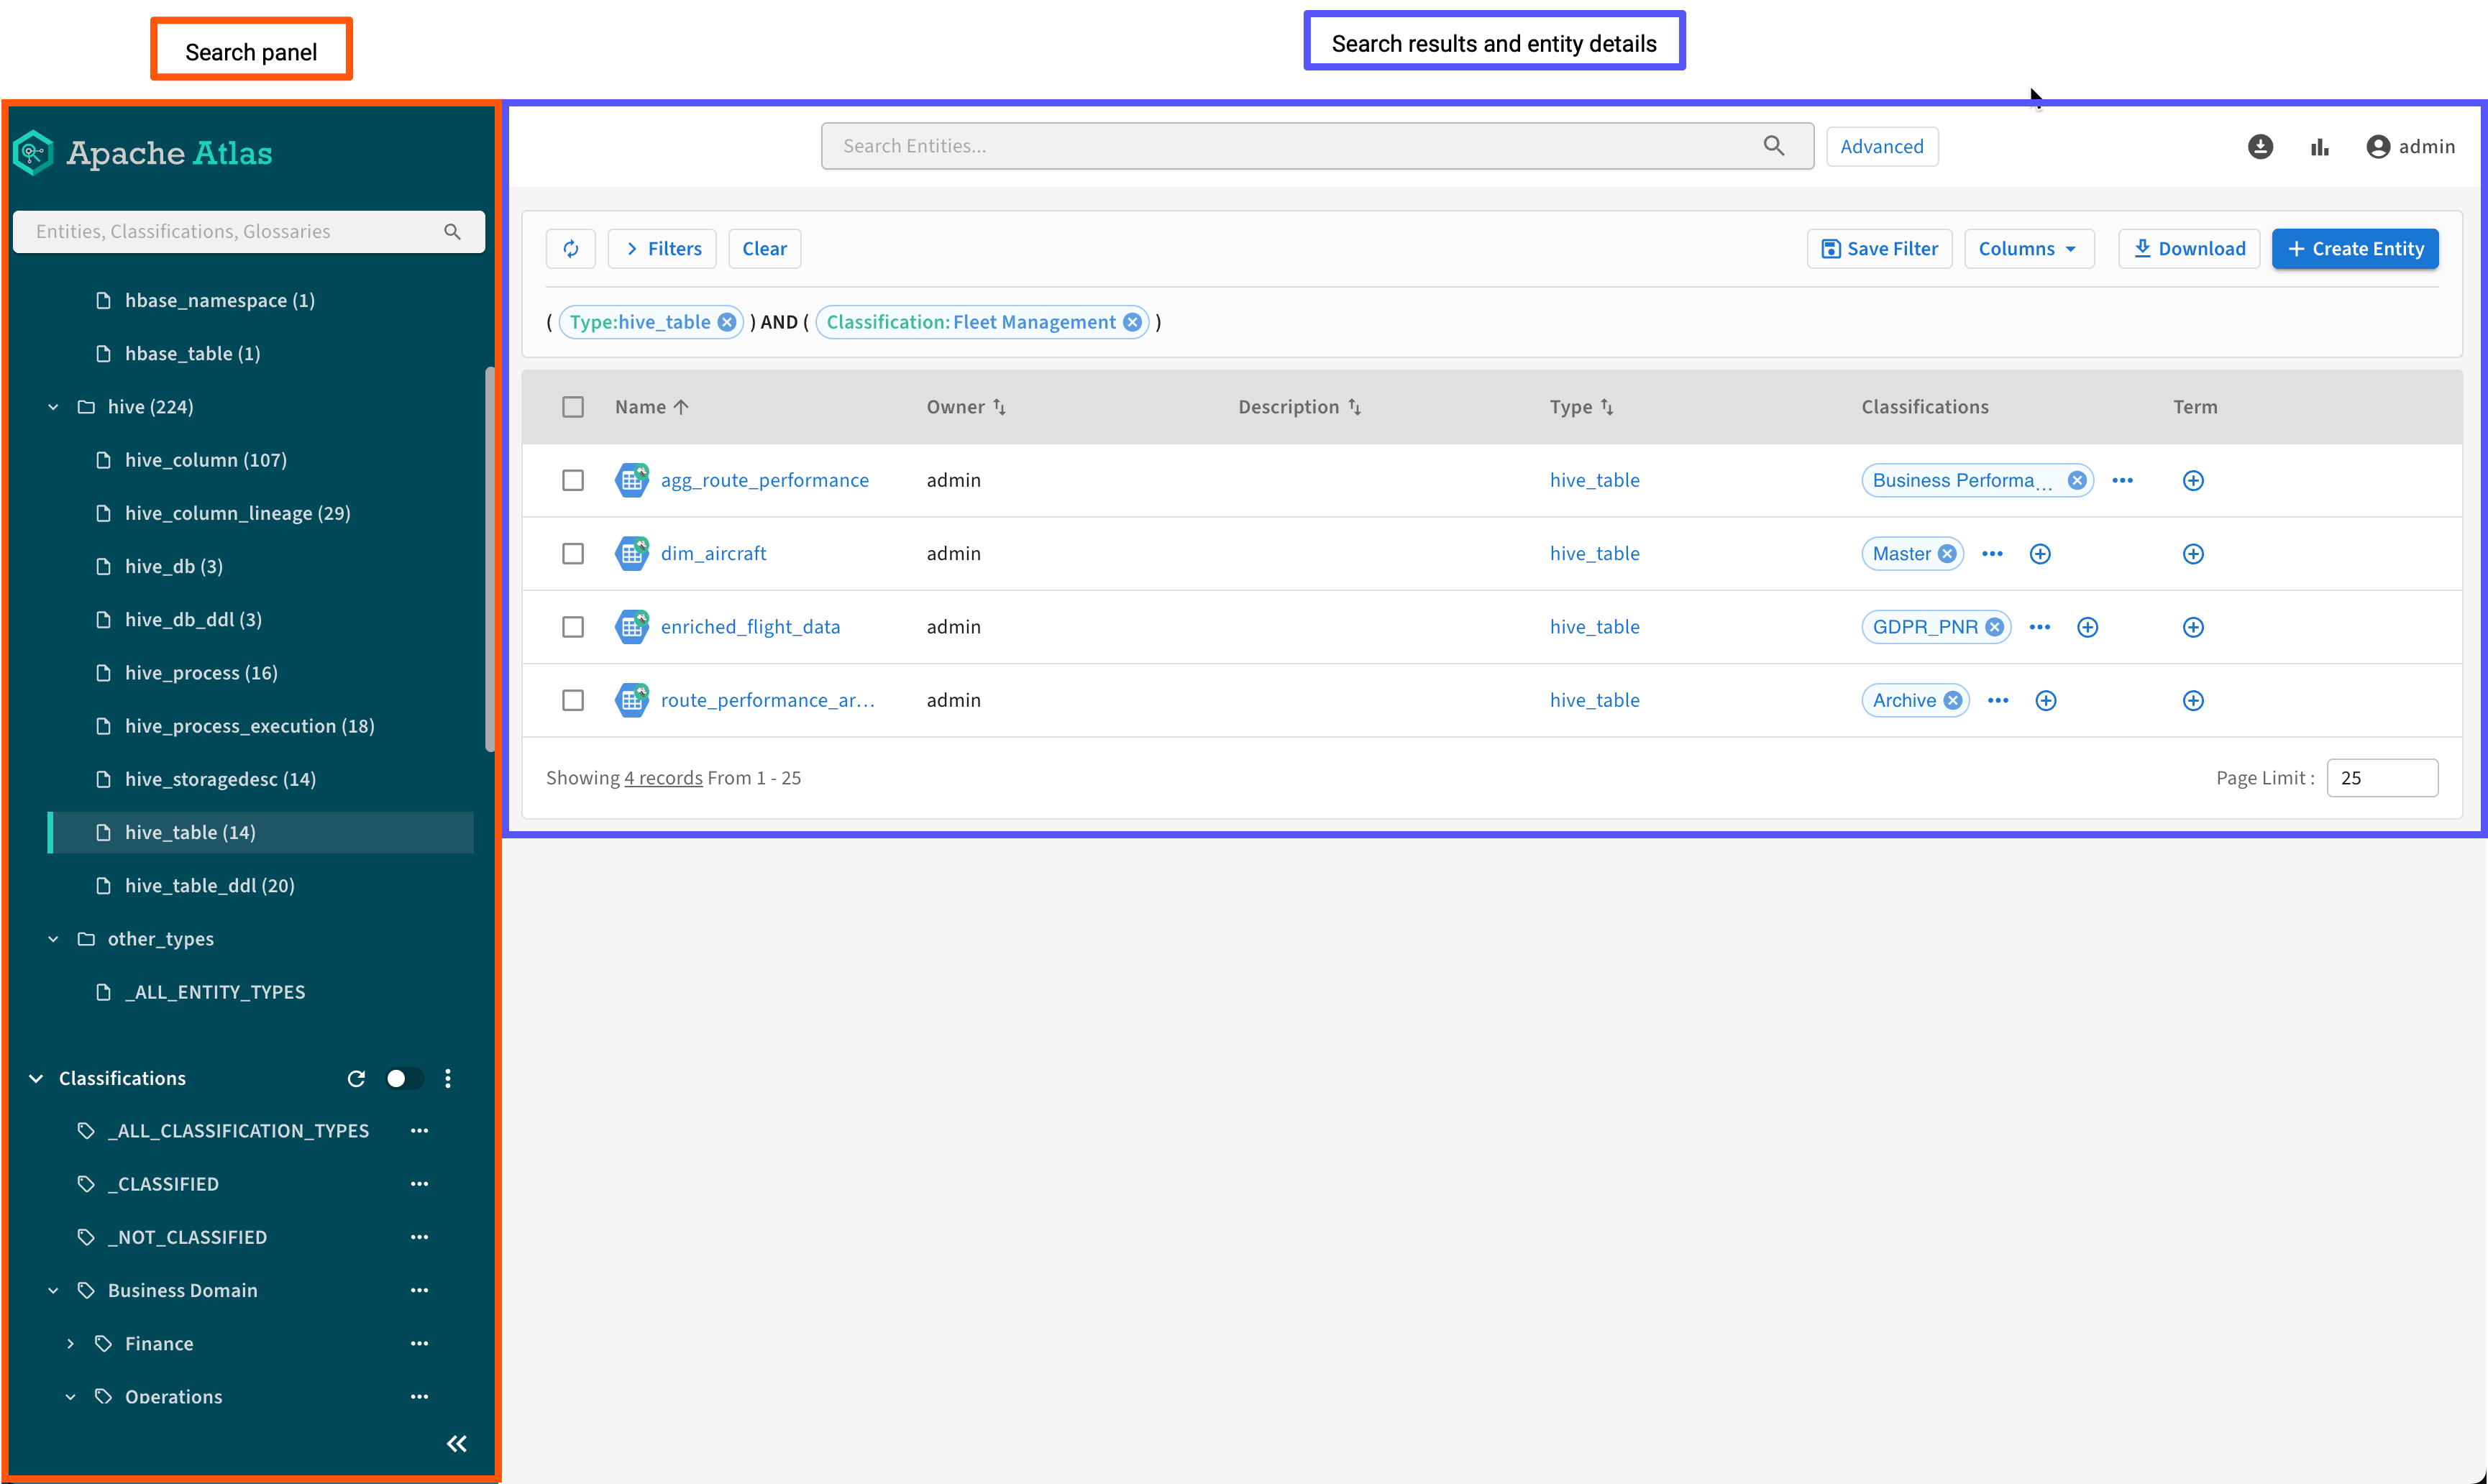
When Atlas returns search results, the UI displays a paginated list of entities that match the search criteria. You can return to search options to further refine your search or use the available controls to change the search result presentation.
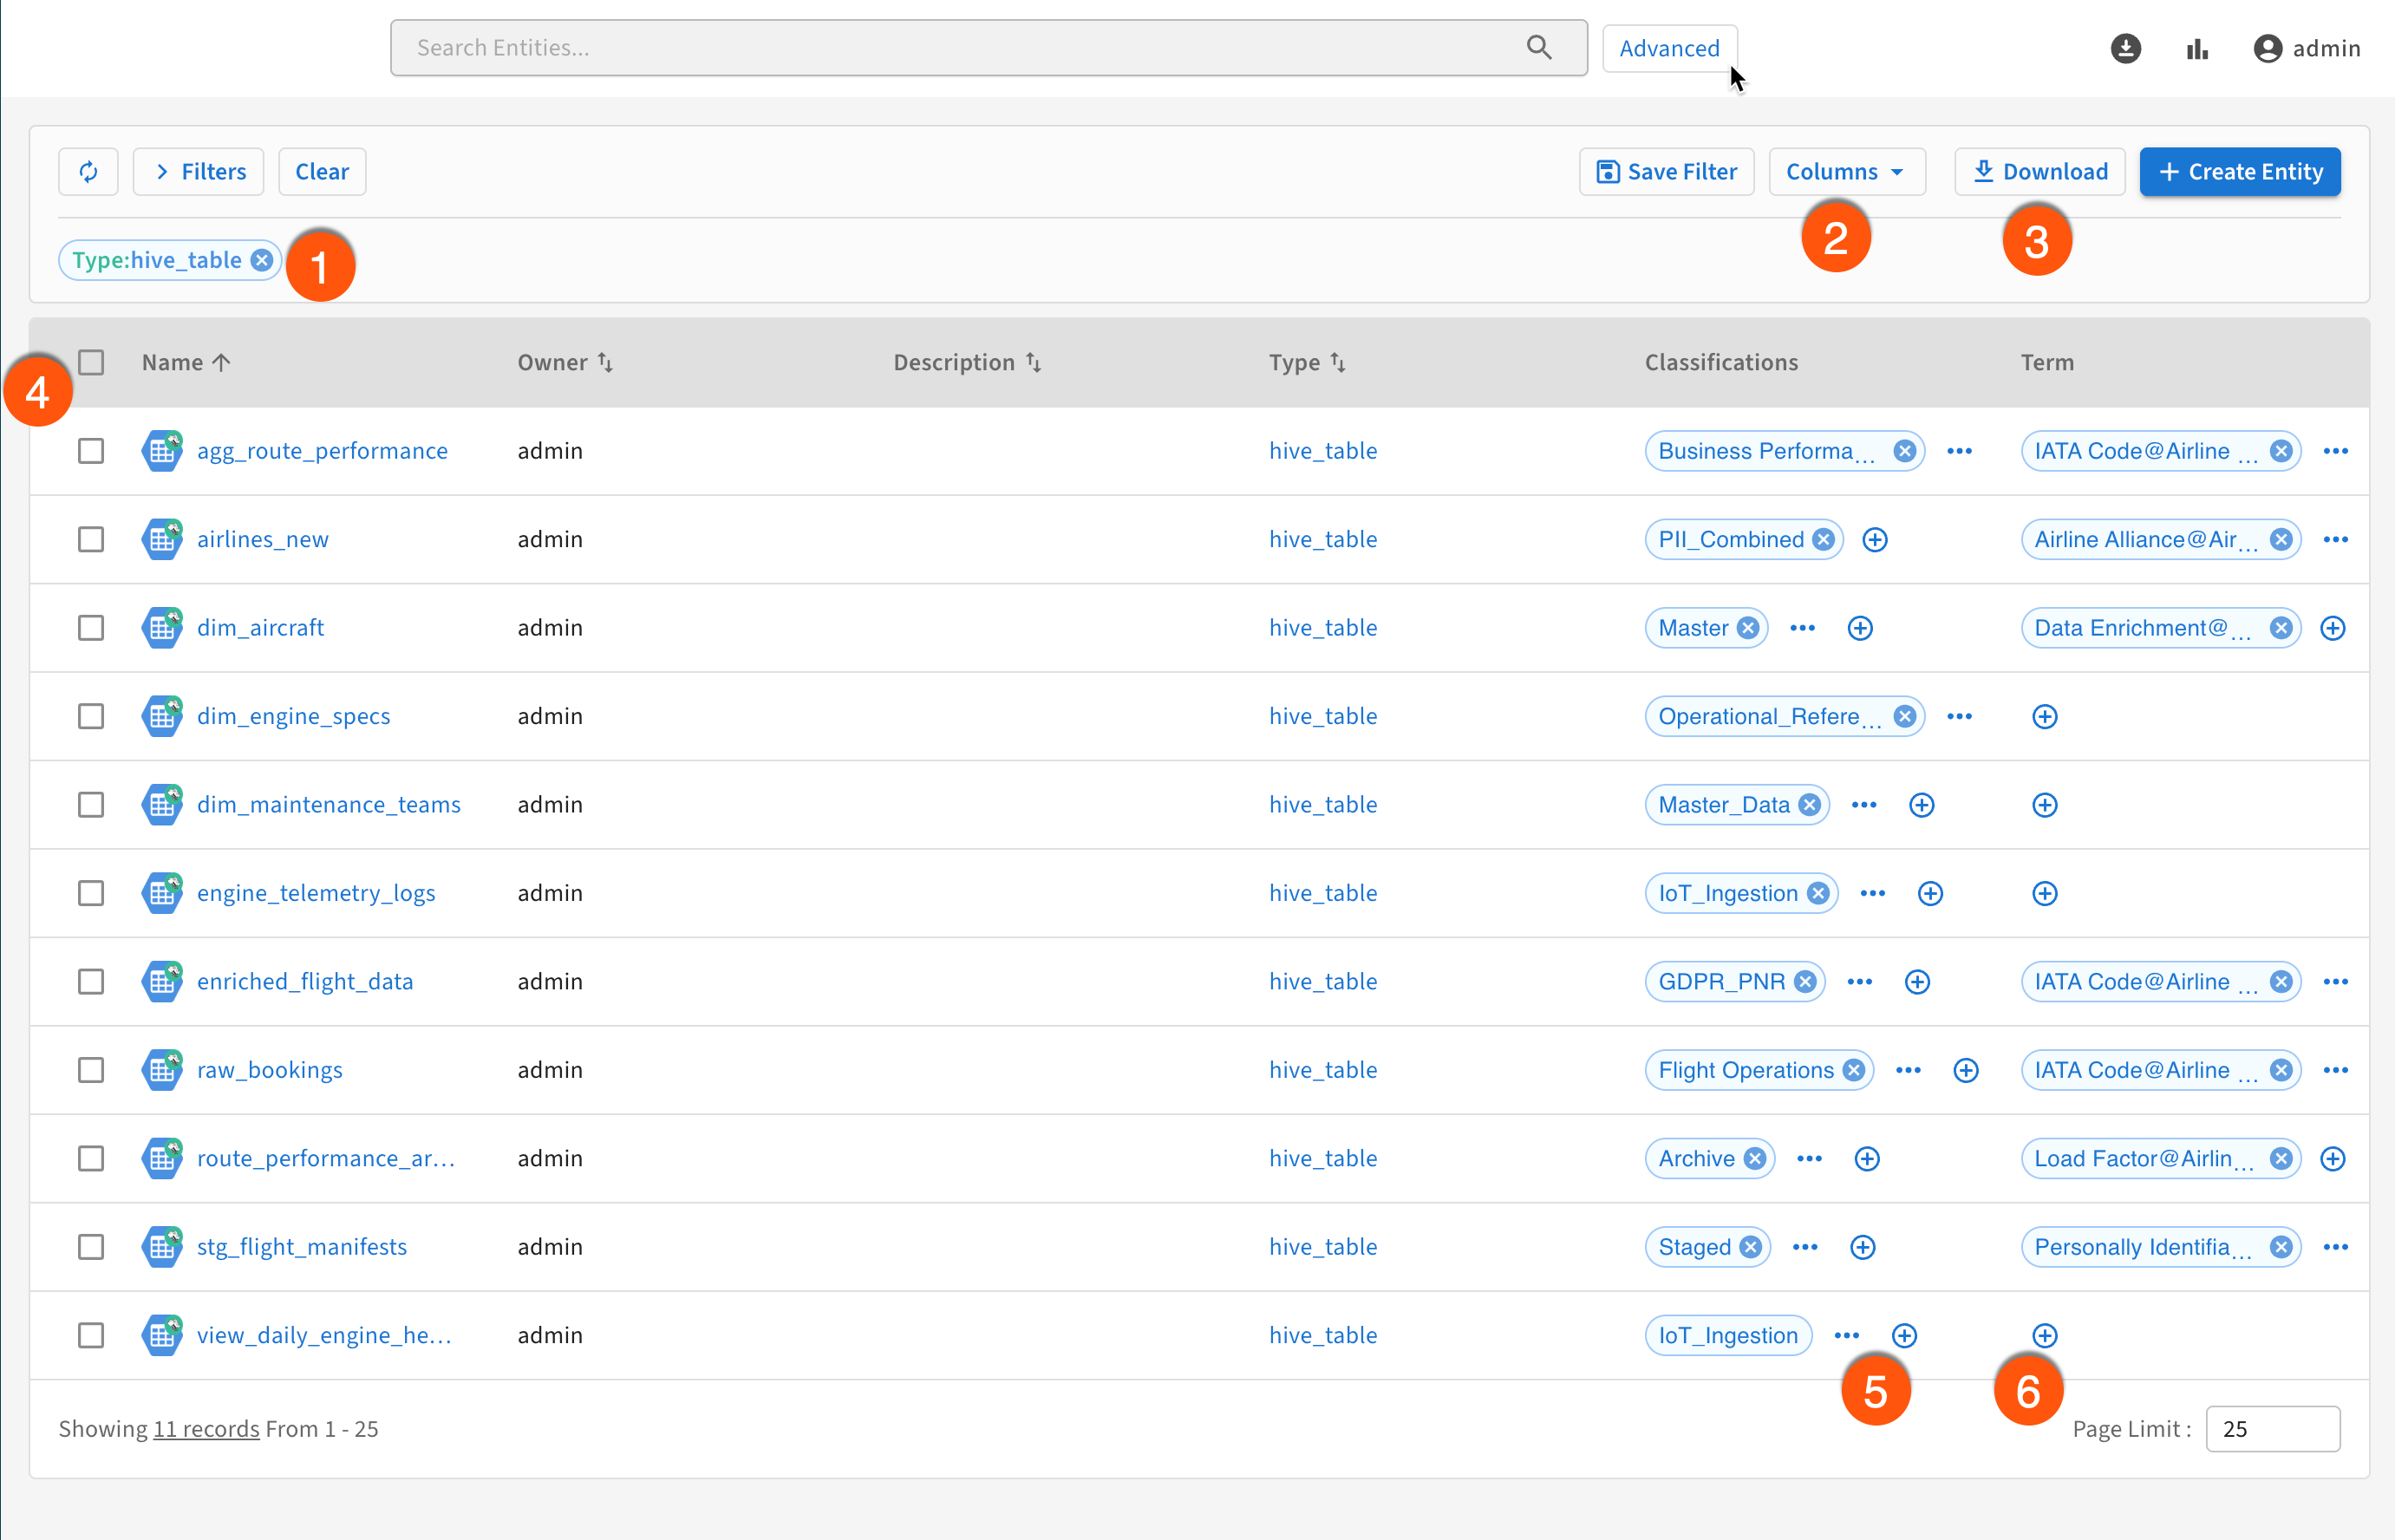
- View the search criteria set in the Search panel.
- Control which attributes of the entities are displayed in the columns.
- Download the selected search results as a CSV file.
- By selecting the checkboxes, mark multiple entities for export or for applying classifications or terms.
- Add classifications by clicking the
 icon. View the classifications that do not fit the screen
by clicking the
icon. View the classifications that do not fit the screen
by clicking the  icon.
icon. - Add terms by clicking the icon. View the terms that do not fit the screen by clicking
the icon.
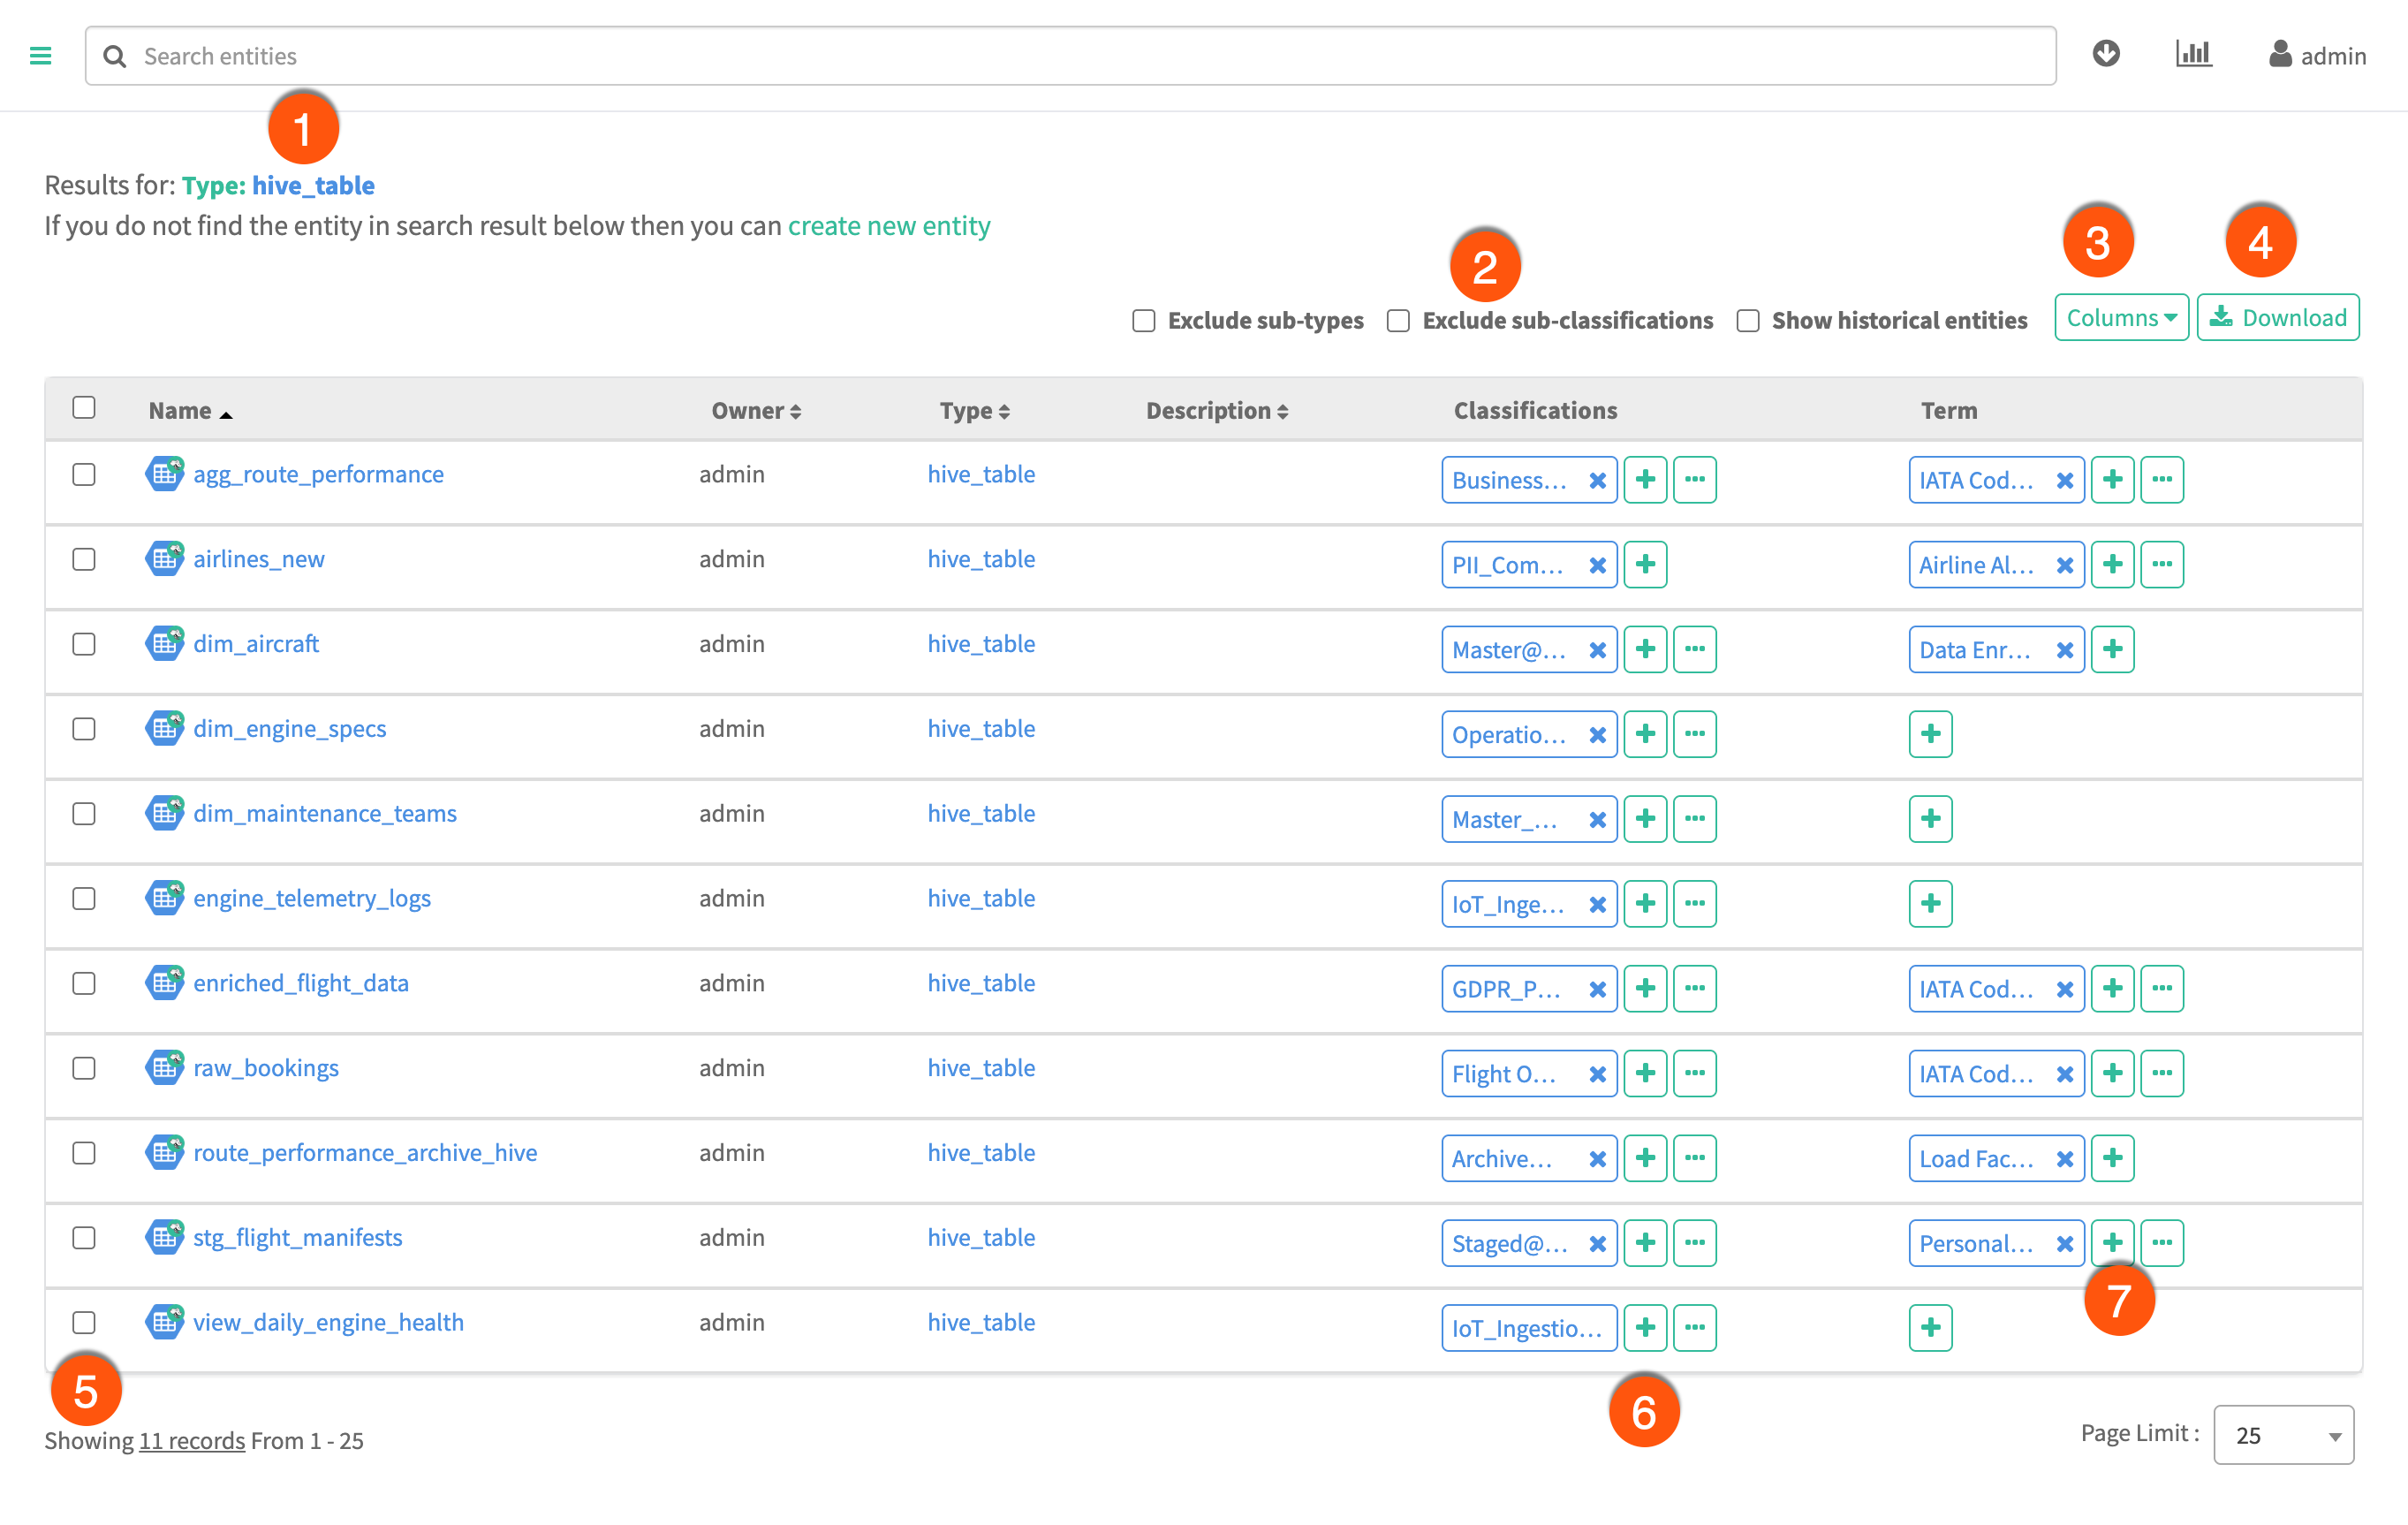
- View the search criteria set in the Search panel.
- By selecting the checkboxes, remove the following entity types from the result
list:
- Sub-types
- Sub-classifications
- Historical entities that are entities marked as deleted
- Control which attributes of the entities are displayed in the columns.
- Download the selected search results as a CSV file.
- By selecting the checkboxes, mark multiple entities for export or for applying classifications or terms.
- Add classifications by clicking the icon. View the classifications that did not fit the screen
by clicking the
icon.
- Add terms by clicking the icon. View the terms that did not fit the screen by
clicking the
icon.
Viewing entity details
In 7.1.9 SP2, 7.3.2.10000, and higher versions, the first load of an entity detail page omits large embedded relationship payloads so the page opens faster and stays responsive for entities with very large relationship graphs. Relationship and schema rows load when you open the Relationships or Schema tab. In lower versions, relationship data can be included in the initial response, which can slow or block the UI for those entities.
When you click a link for an entity in the search results, Atlas opens an entity detail page that includes the metadata collected for the entity. The detail page organizes the entity content in the following tabs:
- Properties Includes the system metadata collected for this entity and any user-defined properties. It also contains a list of labels applied to the entity. Use values from any of the string data type properties to find this entity using free-text search.
- Lineage Displays a lineage graph for each entity. For data asset entities, the lineage graph is displayed when the entity functioned as an input or an output for an operation. For process entities, the lineage graph displays all input and output entities used by or produced by the operation.
- Relationships Lists the other entities associated with the
current entity. You can view the related entities as a list or as a graph and use this tab
to navigate among entities. The
inputandoutputrelationship types include the entities that make up the lineage. In 7.1.9 SP2, 7.3.2.10000, and higher versions, you can switch between Table mode (a card per relationship type) and Graph mode (the lineage-style graph). Each card displays a count, optional sort controls, an option to include deleted relationships, and loads related entities in pages as you scroll so large graphs stay usable.Figure 28. Relationships displayed in card mode 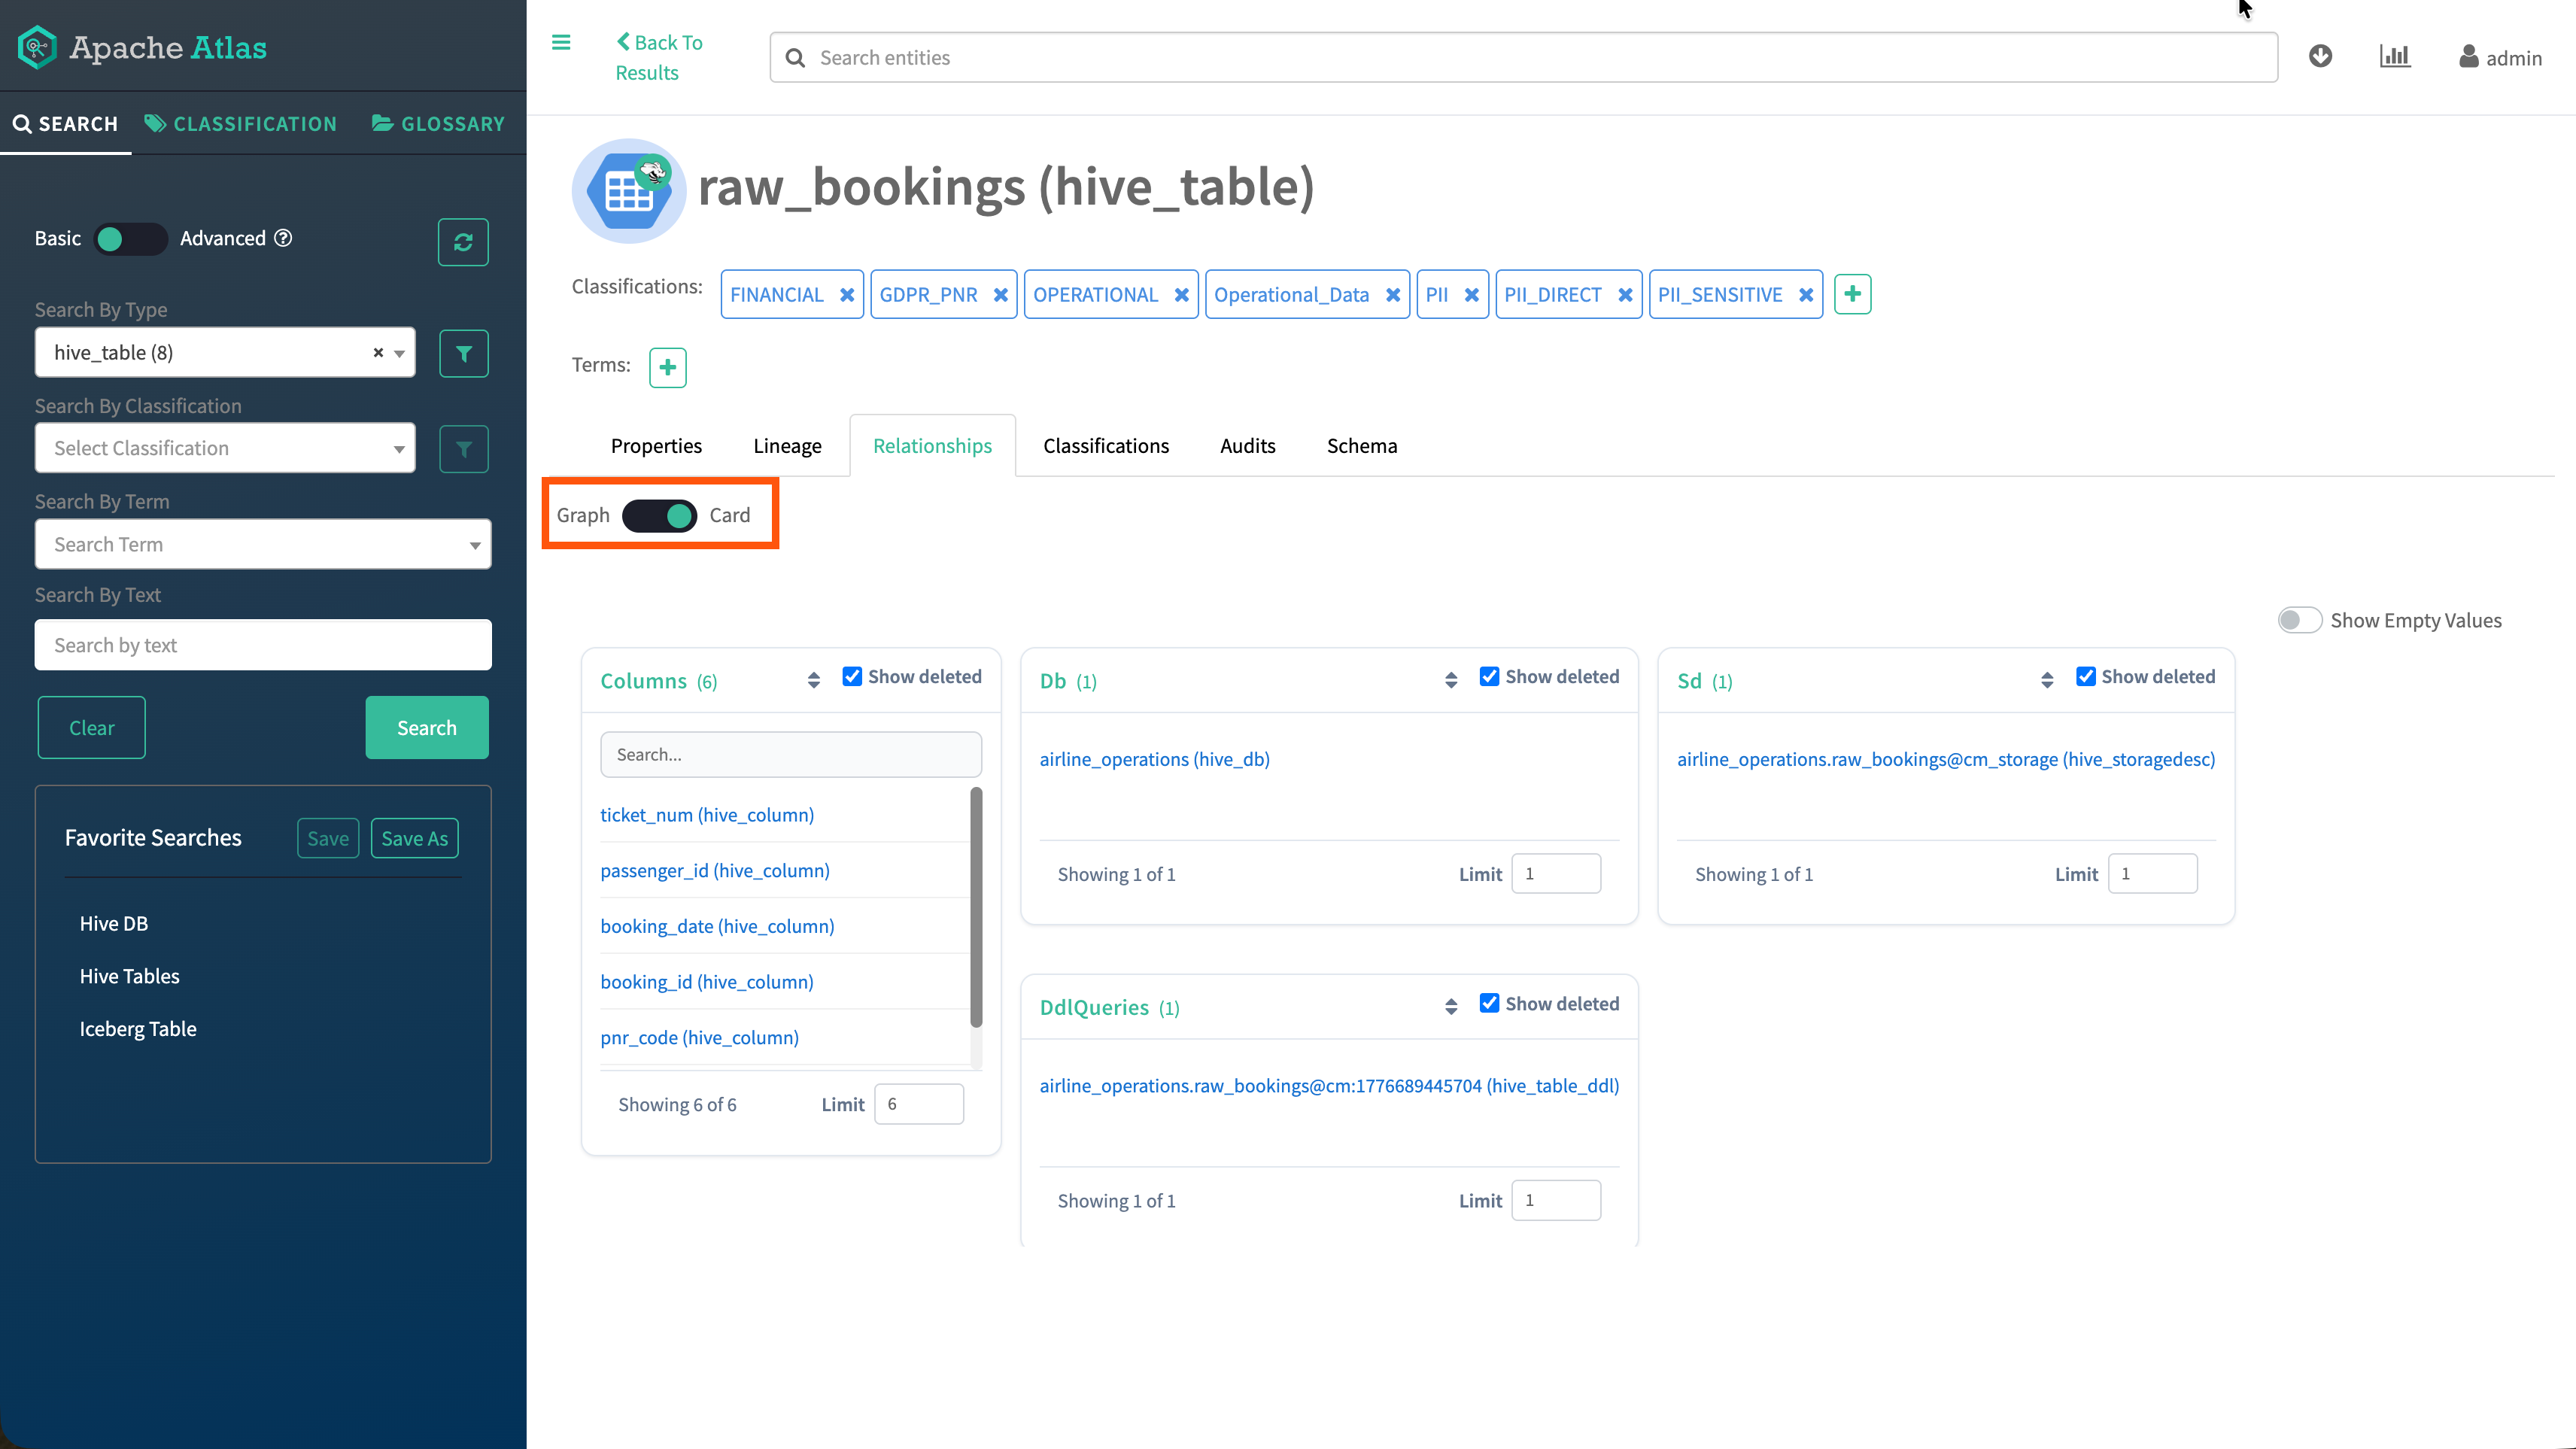
Figure 29. Relationships displayed in graph mode 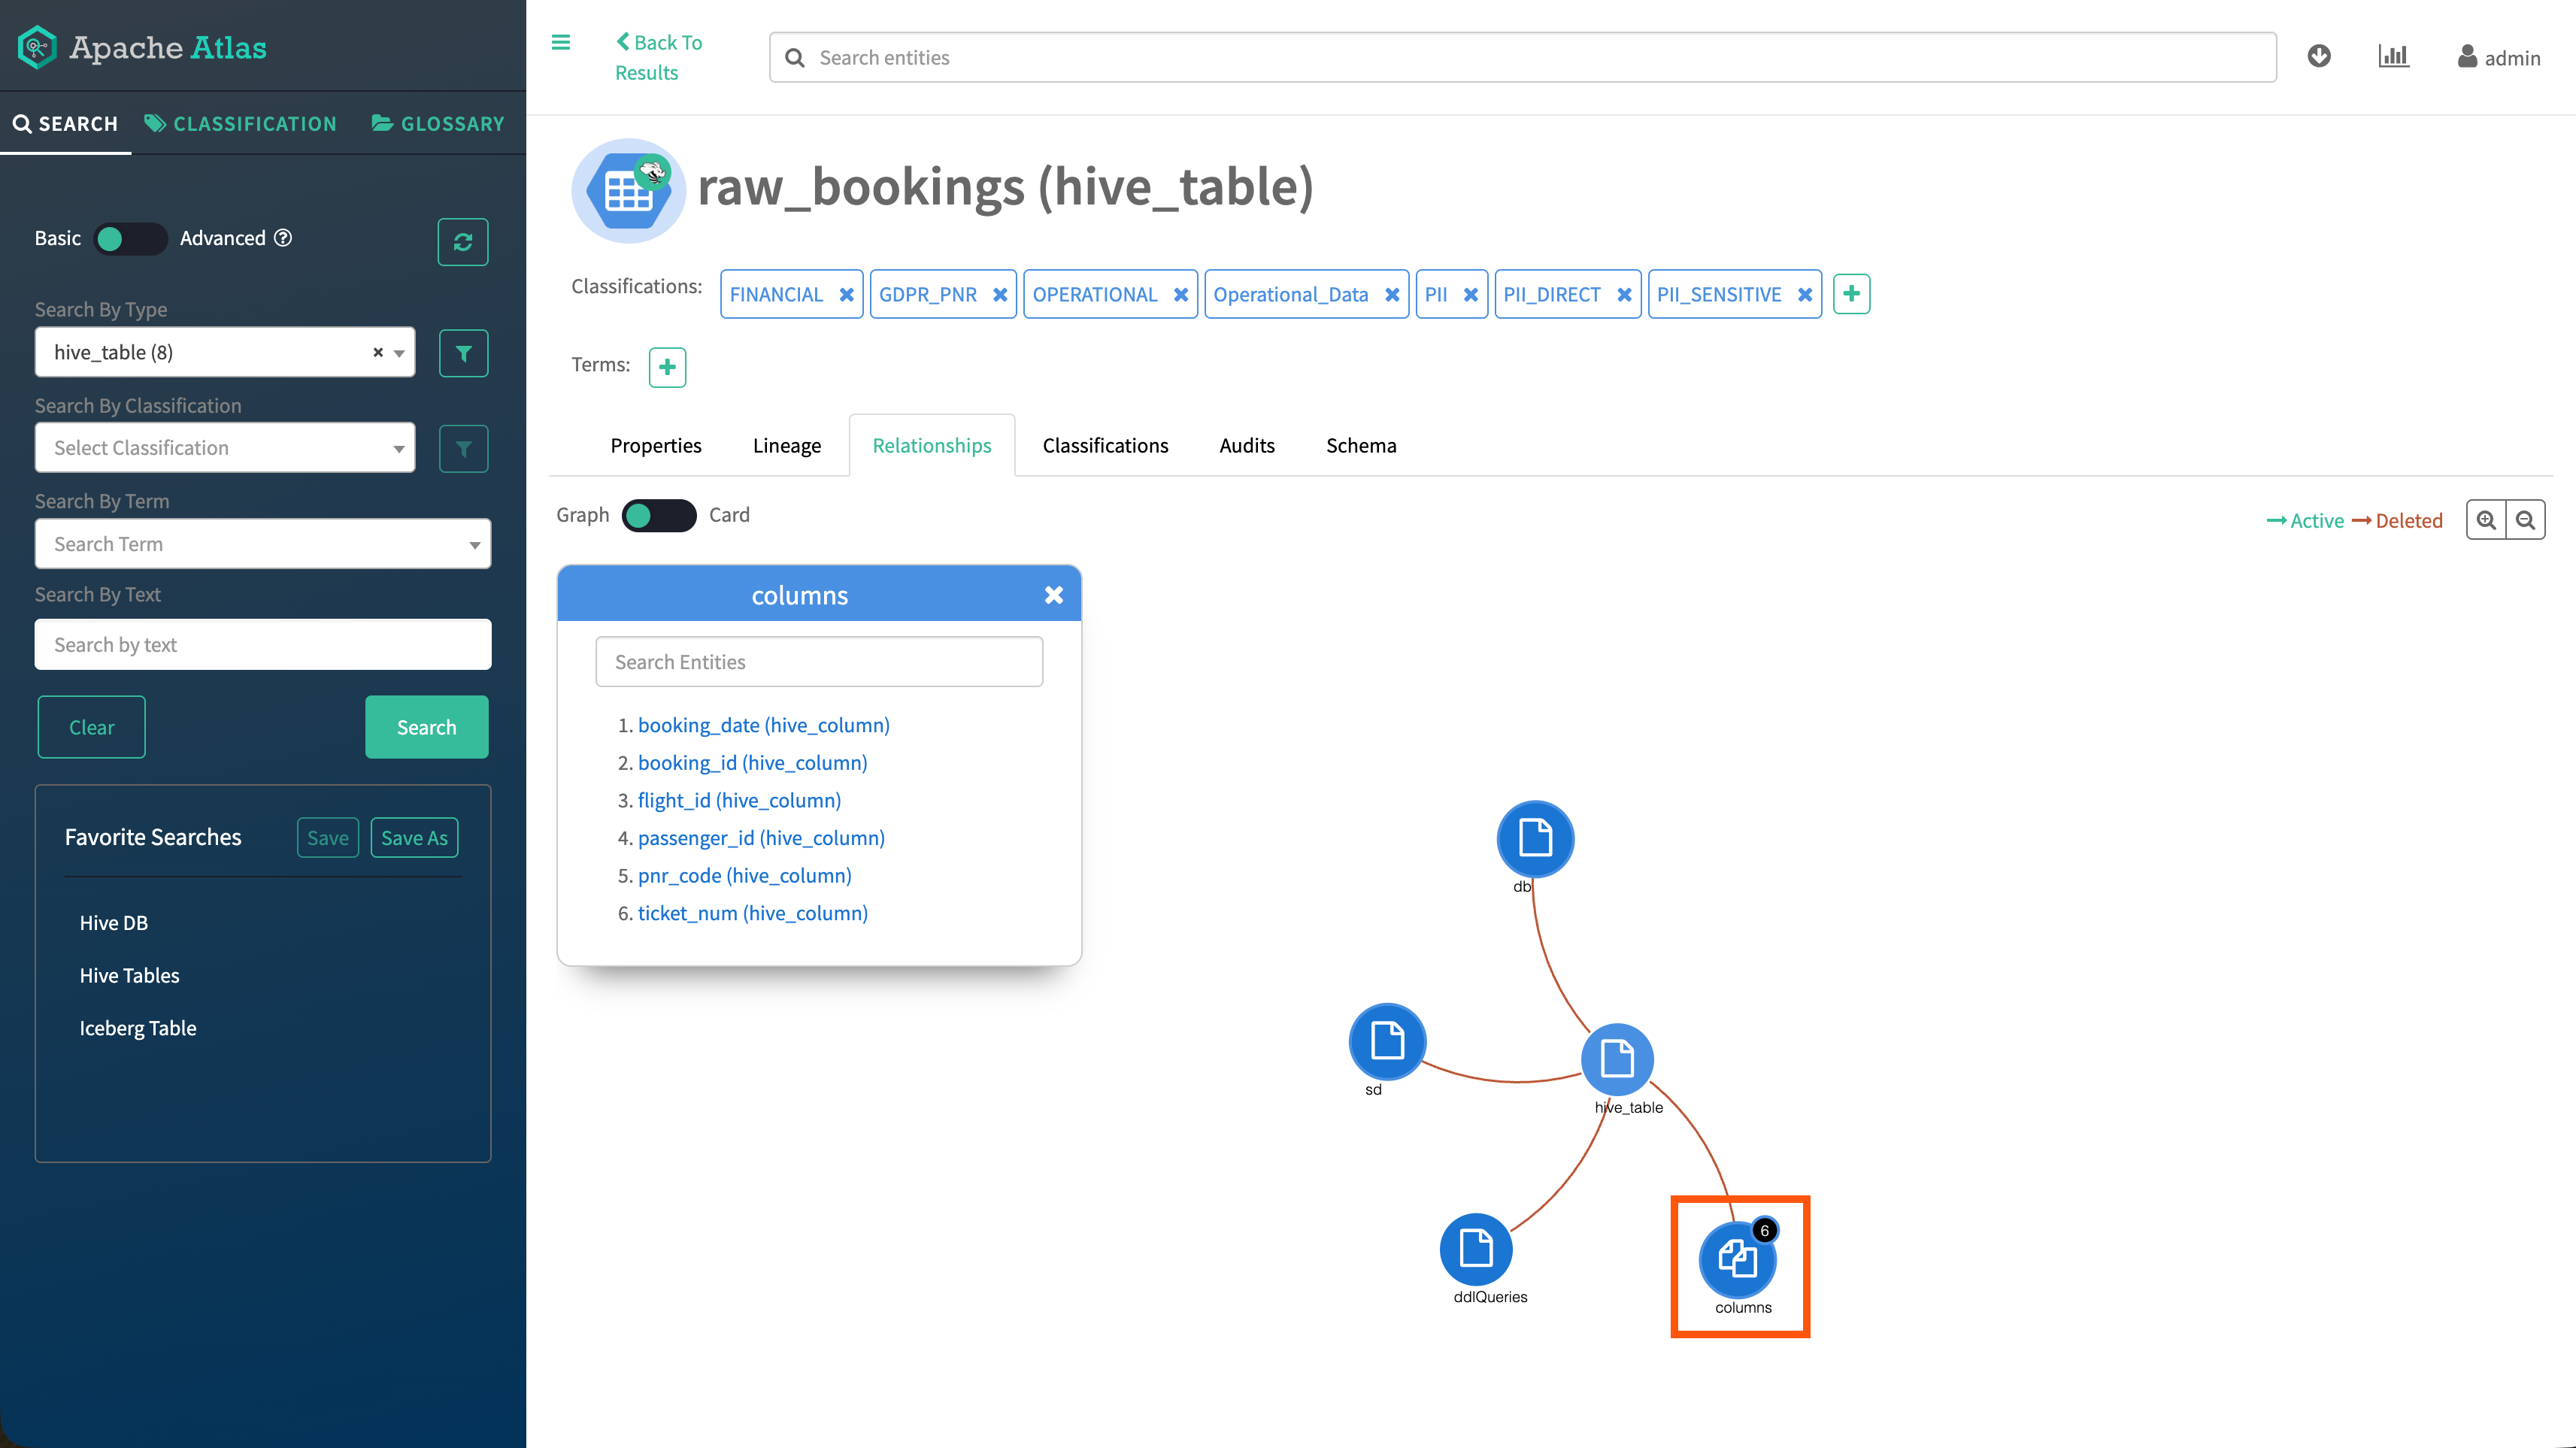
Click the graph nodes to display the connected entities.
In lower versions, the tab relies on relationship data from the initial entity response, which can fail to render for large relationship graphs (for example, a Hive table with more than 10,000 column relationships). In addition, the
searchRelatedEntitiesAPI always applies default alphabetical sorting, increasing response times for large result sets. Approximate relationship counts can be inaccurate when deleted entities are excluded, and attributes referencing multiple entity types (for example,hive_db.tablescontaining bothhive_tableandhbase_table) return entities of only a single type instead of all related entities. - Classifications Displays the classifications associated with this entity and are also displayed in the top section of the detail page. This tab allows you to add, update, or remove classifications from the entity.
- Audits Records the changes that occur to entity metadata. It
displays when and how Atlas updated the entity's metadata, including the following
changes:
- Classifications added or removed
- Entity attributes updated
- Labels added, updated, or removed
- Relationships added, updated, or removed
- Glossary terms added or removed
- Schema Is only displayed when the current entity is a table and lists columns in that table. Use this tab to drill into a specific column or to add classifications to columns without opening the individual column detail page. In 7.1.9 SP2, 7.3.2.10000, and higher versions, column rows load when you open this tab, using the same on-demand relationship loading pattern as the Relationships tab.