Agent details in CEM
Learn how to check individual agent details, view the alerts, view the configurations, check the status, and follow the history of the triggered commands.
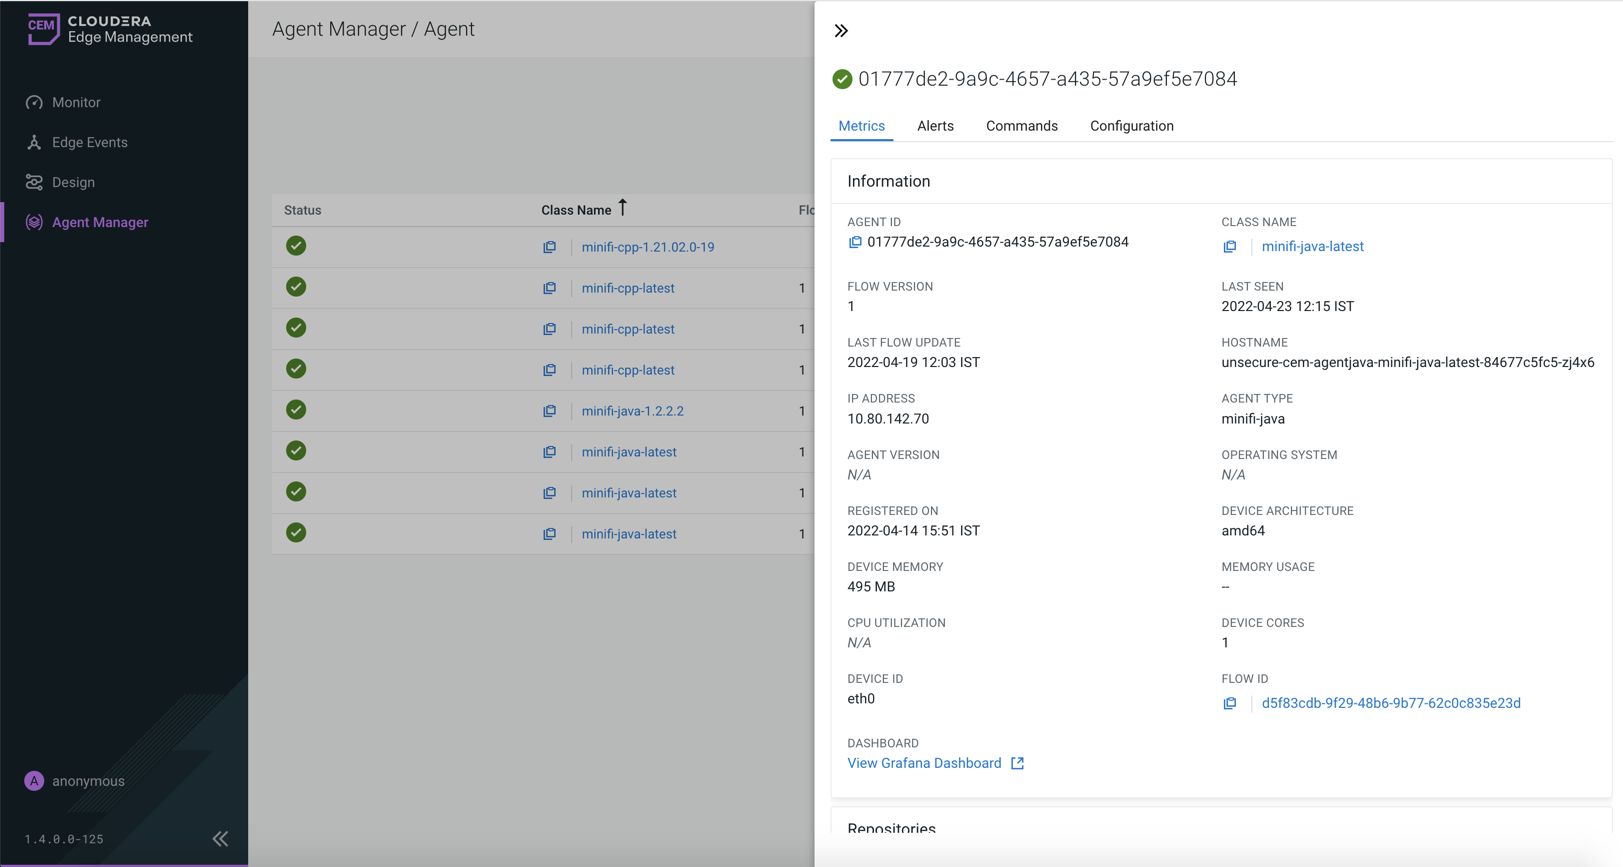
Metrics tab
In the Information panel, you get a general overview of the agent status, deployed flow version, and other useful device information. You can reach the agent class details or the designer of the given agent class if you click on the given element.
The Repositories panel provides usage details of the repositories of the selected agent (where applicable).
The Connection Queues panel displays all of the connections used in the given agent along with its metrics.
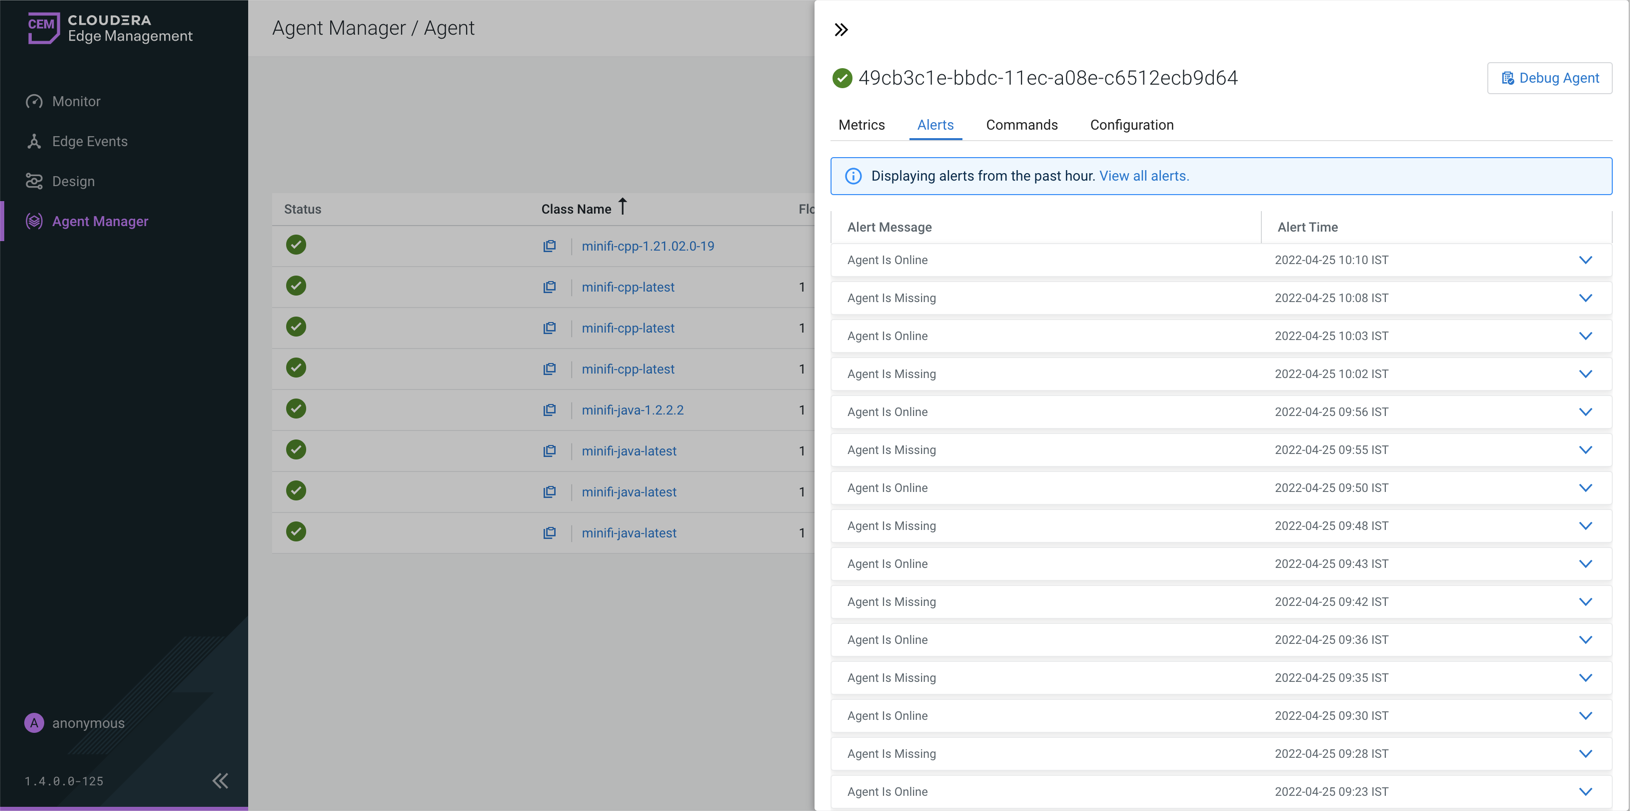
Alerts tab
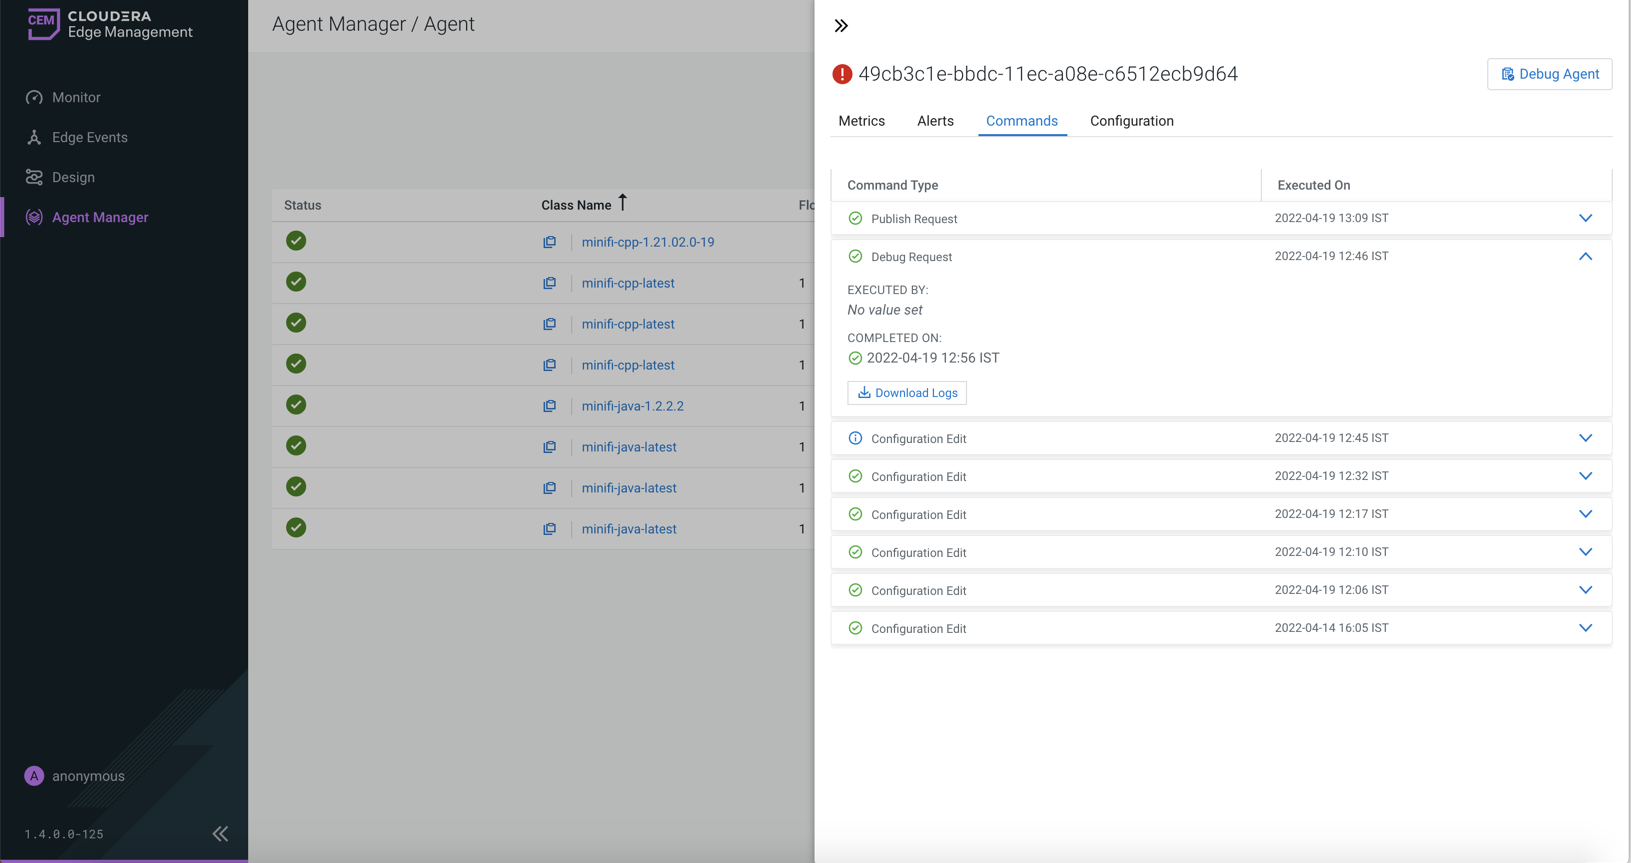
Commands tab
In the Commands tab, you can check the last 20 commands and
their statuses which were sent to the agent. You can configure the number of displayed items
through the efm.agentManager.commands.displayLimit property in the
efm.properties file.
Configuration Edit command, you can check the affected property name, as
shown in the following image: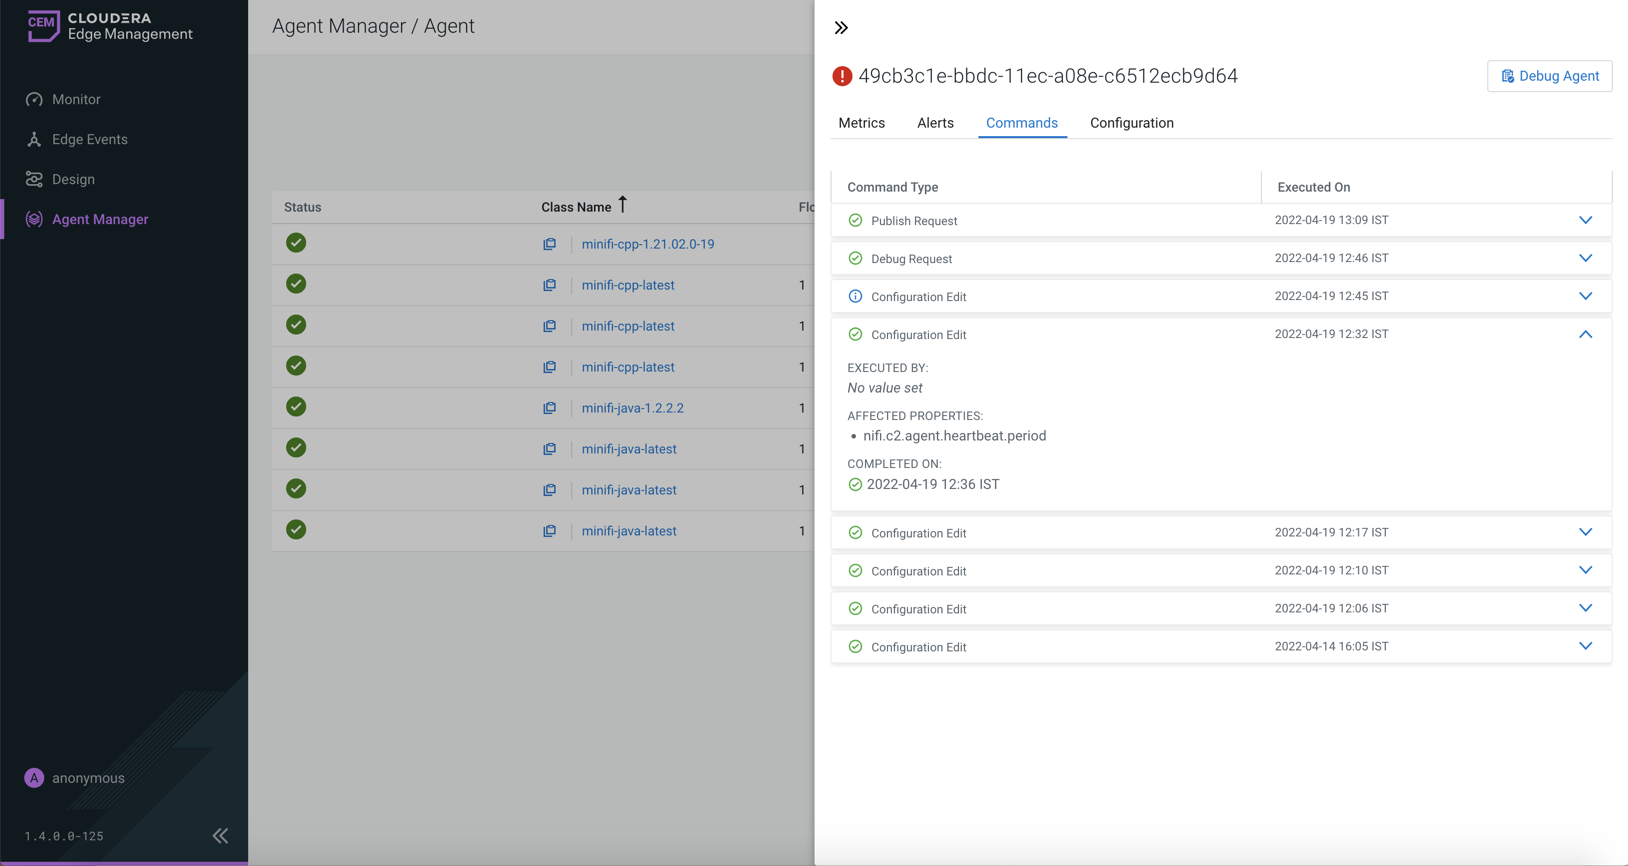
The execution of the command was not required as the agent was already in the
     desired state.
message, as shown in the following image: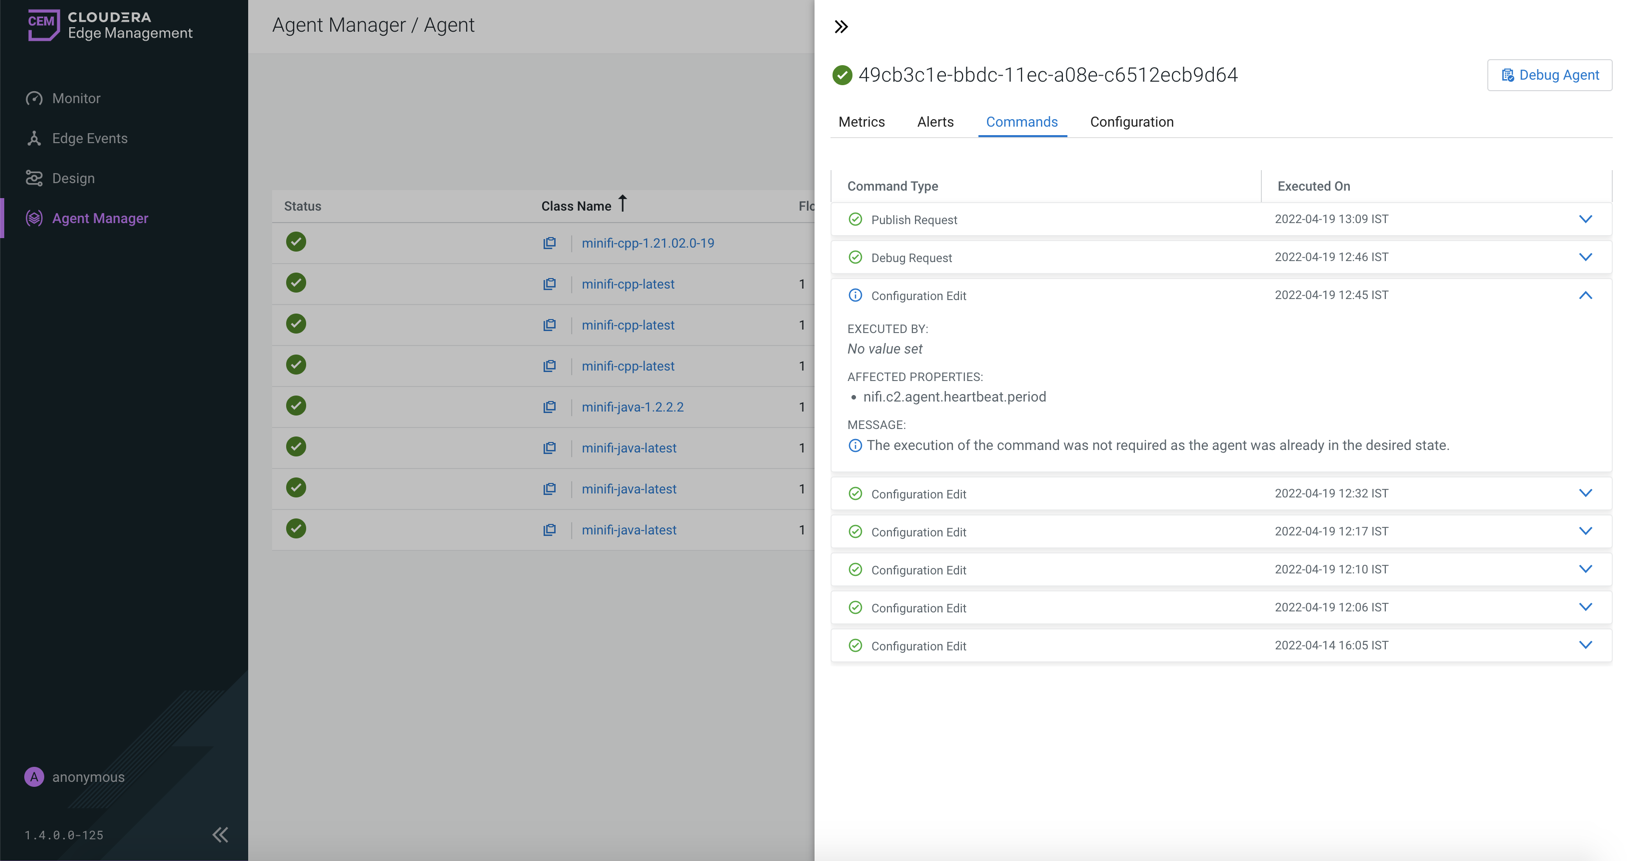
Configuration tab
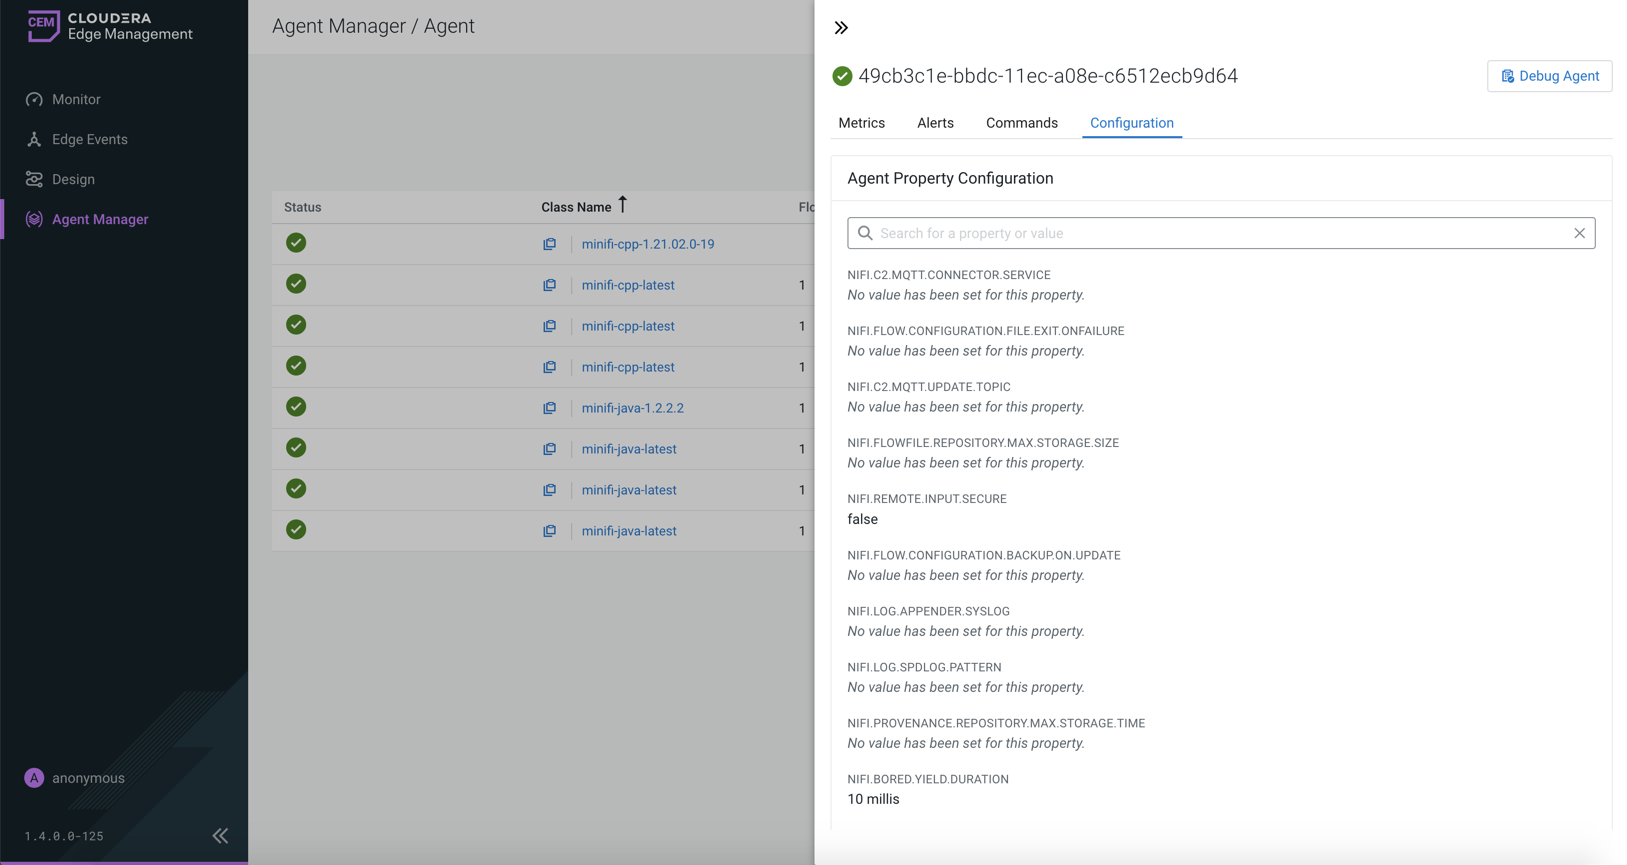
CEM also supports editing properties at agent class level. For more information, see Monitoring deployments in CEM.
Debug Agent button
The debug command functionality allows you to collect debug information from agents utilizing the C2 protocol. For more information, see Debug agent in CEM.