
FAQ
The following topic covers frequently asked questions about charting time-series data.
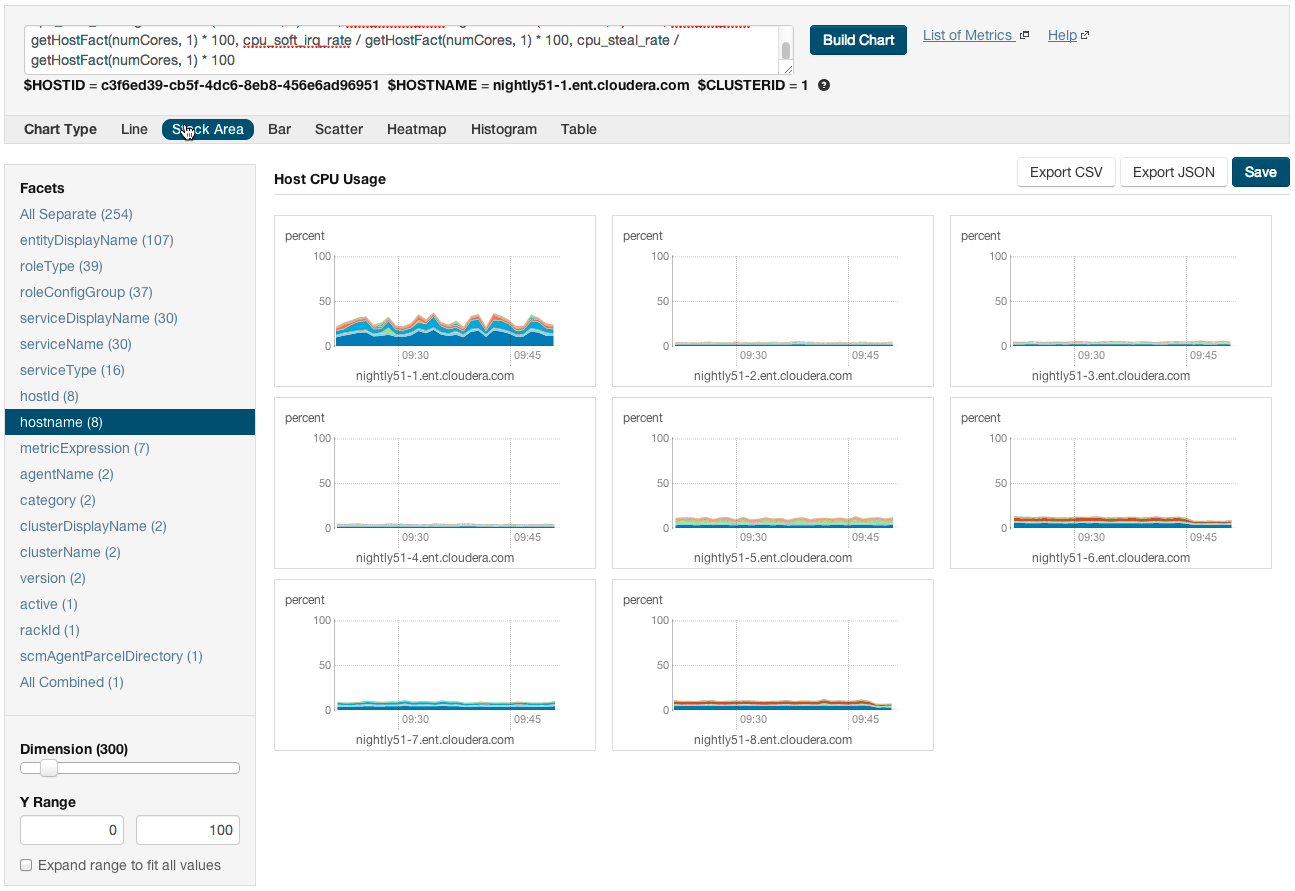
- How do I compare information across hosts?
-
- Click Hosts in the top navigation bar and click a host link.
- In the Charts pane, choose a chart, for example Host CPU Usage and select
 and then Open in Chart Builder.
 - In the text box, remove the
where entityName=$HOSTIDclause and click Build Chart. - In the Facets list, click hostname to compare the values across hosts.
- Configure the time scale, minimums and
maximums, and dimension. For example:
- How do I compare all disk IO for all the DataNodes that belong to a specific HDFS service?
- Use a query of the
form:
select bytes_read, bytes_written where roleType=DATANODE and serviceName=hdfs1
replacinghdfs1with your HDFS service name. Then facet by metricDisplayName and compare all DataNodebyte_readsandbyte_writesmetrics at once. - When would I use a derivative function?
- Some metrics represent a counter, for example,
bytes_read. For such metrics it is sometimes useful to see the rate of change instead of the absolute counter value. Usedtordt0derivative functions. - When should I use the
dt0function? - Some metrics, like
bytes_readrepresent a counter that always grows. For such metrics a negative rate means that the counter has been reset (for example, process restarted, host restarted, and so on). Usedt0for these metrics. - How do I display a threshold on a chart?
- Suppose that you want to retrieve the
latencies for all disks on your hosts, compare them, and show a
threshold on the chart to easily detect outliers. Use the following
query to retrieve the metrics and the threshold:
select await_time, await_read_time, await_write_time, 250 where category=disk
Then choose All Combined (1) in the Facets list. The scalar threshold250will also be rendered on the chart: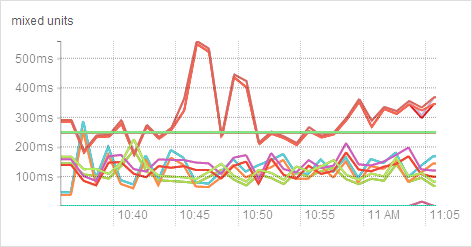
- I get the warning "The query hit the maximum results limit". How do I work around the limit?
- There is a limit on the number of results that can be returned
by a query. When a query results in more time-series streams than the limit a warning for
"partial results" is issued. To circumvent the problem, reduce the number of metrics you
are trying to retrieve or see the topic Configuring Time-Series Query
Results. You can use theyou can use
rlikeoperator to limit the query to a subset of entities. For example, instead ofselect await_time, await_read_time, await_write_time, 250 where category=DISK
select await_time, await_read_time, await_write_time, 250 where category=DISK and hostname rlike "host1[0-9]?.cloudera.com"
The latter query retrieves the disk metrics for ten hosts. - How do I discover which metrics are available for which entities?
-
- Type Select in the text box and then press Space or continue typing. Metrics matching the letters you type display in a drop-down list.
- Select , click the question mark icon
 to the right of the Build Chart button and click the List of Metrics link
 - Retrieve all metrics for the type of entity:
select * where roleType=DATANODE
