Performing a Data Hub major/minor version upgrade

A major/minor version upgrade initiates an upgrade of the major/minor Cloudera Manager and Runtime versions, as well as the required additional parcels (Spark3, Flink, Profiler, and Cloudera Flow Management). After you perform a major/minor upgrade on a Data Lake, you should in most cases perform a major/minor version upgrade on each Data Hub attached to the Data Lake. The Data Hubs must run the same major/minor Runtime version as the Data Lake--with the exception of Data Hubs on Runtime 7.2.16+, which are compatible with Data Lake versions 7.2.17+.

Note that for major/minor version upgrades, the cluster can only be upgraded to the same major/minor version as the Data Lake, so you must first upgrade the Data Lake. For instructions, see Data Lake upgrades.

Complete the steps for each Data Hub cluster that you are upgrading.

Required role: DatahubAdmin or Owner over the Data Hub

  1. Start the cluster.
  2. Before you begin the Data Hub upgrade, check if the current version of Cloudera Runtime is <= 7.1.0.0. If yes, then verify the memory settings for Cloudera Manager in the /etc/default/cloudera-scm-server file on the Cloudera Manager server host. If you find the value “-Xmx2G” in CMF_JAVA_OPTS, update it to “-Xmx4G” and restart the Cloudera Manager server after the change.
  3. For clusters that contain the Hive service in Cloudera Runtime versions prior to version 7.2.2, it is required to terminate all running YARN applications before starting the upgrade. So, if the current Cloudera Runtime version is < 7.2.2:
    1. SSH to any Hive node (master or worker).
    2. Get an initial ticket-granting ticket for YARN principal. This passes the Kerberos authentication so that you can run the YARN application in shell. YARN principals are installed in /run/cloudera-scm-agent/process/xxxxx-yarn-RESOURCEMANAGER/yarn.keytab

      Enter the directory and run klist command to display the Kerberos principals in YARN keytab (sample command):

      klist -kt yarn.keytab

      Sample Kerberos principal output: <format: userid/host@domain>

      yarn/nightly-7x-1-1.nightly-7x-1.root.hwx.site@ROOT.HWX.SITE

      From the above directory, run kinit command in this format (sample command): kinit -kt yarn.keytab <kerberos-principal format: userid/host@domain>

      kinit -kt yarn.keytab yarn/nightly-7x-1-1.nightly-7x-1.root.hwx.site@ROOT.HWX.SITE
    3. Run the command: yarn application -list
    4. For each running YARN application, run the command: yarn application -kill <appId>
    5. Run the command (to verify that no apps are running): yarn application -list
  4. For Streams Messaging clusters, if you are upgrading from Runtime version 7.2.12 to 7.2.14, complete the following steps:
    1. Open the CM UI for the Streams Messaging cluster.
    2. Click on the Cruise Control service, then click on Configurations.
    3. Search for 'RackAwareGoal' in the search bar and remove the entry for 'com.linkedin.kafka.cruisecontrol.analyzer.goals.RackAwareGoal' for 'Default goals,' 'Hard Goals,' 'Support Goals,' ‘Self-Healing Goals, and 'Anomaly Goals.'
    4. Save the changes and restart the Cruise Control service.
    5. Proceed with the upgrade, but note that once the upgrade is complete, add the entries back to 'Default goals', 'Hard Goals', 'Support Goals,' ‘Self-Healing Goals,’ and 'Anomaly Goals.' This time rename the value to 'com.linkedin.kafka.cruisecontrol.analyzer.goals.RackAwareDistributionGoal'
  5. If your cluster uses Streams Replication Manager, export or migrate aggregated metrics.
    In Cloudera Runtime 7.2.18, major changes are made to the internal Kafka Streams application of SRM. As a result, SRM by default loses all aggregated metrics that were collected before the upgrade. This means that you will not be able to query metrics with the SRM Service REST API that describe the pre-upgrade state of replications. If you want to retain the metrics, you can either export them, for archival purposes, or migrate them to the new format used by SRM. If you do not need to retain metrics, you can skip this step and continue with the upgrade.

    Exporting metrics creates a backup of the metric data, however, exported metrics cannot be imported into the SRM Service for consumption. As a result, exporting metrics is only useful for data archival purposes.

    Migrating metrics can be done in two different ways depending on whether you are doing a rolling upgrade or a non-rolling upgrade.

    • In case of a non-rolling upgrade, migration happens following the upgrade. In this case, the new version of the internal Kafka Streams application running in the upgraded cluster starts to process historical metrics as soon as it is online. However, until the metrics are processed, the SRM Service cannot serve requests regarding latest metrics and returns empty or missing responses on its REST API. The duration of this downtime depends on the number SRM Service instances and the amount of metrics in the cluster.
    • In case of a rolling upgrade, a migration process called SRM Service Migrator is initiated during the upgrade. The Migrator processes existing metrics so that they become compatible with your upgraded cluster. Depending on the size of your cluster and the amount of metrics you have, this process may take up to multiple hours to finish.
    Use the following endpoints of the SRM Service REST API to export metrics.
    If upgrading from Cloudera Runtime 7.2.12 or higher:
    • /v2/topic-metrics/{source}/{target}/{upstreamTopic}/{metric}
    • /v2/cluster-metrics/{source}/{target}/{metric}
    If upgrading from Cloudera Runtime 7.2.11 or lower:
    • /topic-metrics/{topic}/{metric}
    • /cluster-metrics/{cluster}/{metric}
    For more information regarding the SRM Service REST API, see Streams Replication Manager Service REST API or Streams Replication Manager REST API Reference.
    1. In Cloudera Manager, select the SRM service.
    2. Go to Configuration.
    3. Add the following to the SRM Service Environment Advanced Configuration Snippet (Safety Valve) property:
      Key: SRM_SERVICE_SKIP_MIGRATION
      Value: false
    1. Ensure that the target clusters of the SRM Service are available and healthy.

      If a target cluster is unavailable, the upgrade will fail. As a result, if a target cluster is unavailable, or you expect a target cluster to become unavailable during the upgrade, remove it from SRM’s configuration for the duration of the upgrade. Metrics in the target clusters that you remove are not migrated. Target clusters are specified in Streams Replication Manager Service Target Cluster.

    2. In Cloudera Manager, select the SRM service and go to Configuration.
    3. Add the following to the SRM Service Environment Advanced Configuration Snippet (Safety Valve) property:
      Key: SRM_SERVICE_SKIP_MIGRATION
      Value: false
    4. Fine-tune the behavior of the migration process.

      The SRM Service Metrics Migrator (the migration process) has a number of user configurable properties. Fine tuning the configuration can help in reducing the time it takes to migrate the metrics.

      These properties do not have dedicated entries in Cloudera Manager, instead you must use SRM Service Advanced Configuration Snippet (Safety Valve) for srm-service.yaml to configure them. If you are unsure about configuration, skip configuration and continue with the next step.
      Table 1. SRM Service Migrator properties and recommendations
      Property Default Value Description Cloudera Recommendations
      streams.replication.manager.migrator.monitor.timeout.ms 3,600,000 The time in milliseconds after the Streams Replication Manager (SRM) Service Metrics Migrator times out. Set this timeout to a value that is higher than the expected migration time. Cloudera recommends a value that is at least three times the expected migration time.

      The migration time depends on the amount of metrics in your deployment. The higher the number of metrics, the longer the migration process, and the higher this property must be set.

      For example, a deployment with 10,000 partitions (100 topics with a 100 partitions each) and a 2 hour retention period produces, at minimum, 30,000 metrics per metric emission cycle. In a case like this, migration takes around 10 minutes to finish.

      streams.replication.manager.migrator.monitor.backoff.ms 120,000 The frequency at which the progress of the Streams Replication Manager (SRM) Service Metrics Migrator is checked. The recommended values for this property differ depending on the version you are upgrading from.

      If upgrading from 7.2.12 or higher:

      Set this property to a value that is identical with or similar to the interval set in SRM Service Streams Commit Interval The default value of this property is identical with the default value of SRM Service Streams Commit Interval.

      If upgrading from 7.2.11 or lower:

      Set this property to 30,000 (30 seconds).

      streams.replication.manager.migrator.monitor.stop.delay.ms 60,000 The amount of time in milliseconds that the Streams Replication Manager (SRM) Service Metrics Migrator processes metrics after the streams application is considered caught up
      streams.replication.manager.migrator.monitor.min.consecutive.successful.checks 3 The number of consecutive checks where the lag must be within the configured threshold to consider the Streams Replication Manager (SRM) Service Metrics Migrator successful. All target clusters of the SRM Service must be caught up for a check to be successful.
      streams.replication.manager.migrator.monitor.max.offset.lag Calculated automatically if left empty. The amount of offsets that the streams application in the Streams Replication Manager (SRM) Service Metrics Migrator is allowed to lag behind and still be considered up to date. When left empty, the migration logic will automatically calculate the maximum offset lag based on the Kafka Streams application configuration and the amount of metrics messages. Low offset lag values result in more up-to-date metrics processing following the upgrade, but also increase the time required for the upgrade to finish. An appropriate value for this property is calculated automatically if the property is left empty. As a result, Cloudera recommends that you leave this property empty and use the automatically calculated value.
    5. Click Save Change.
    6. Restart the SRM service.
  6. If you use autoscaling, disable autoscaling on the cluster.
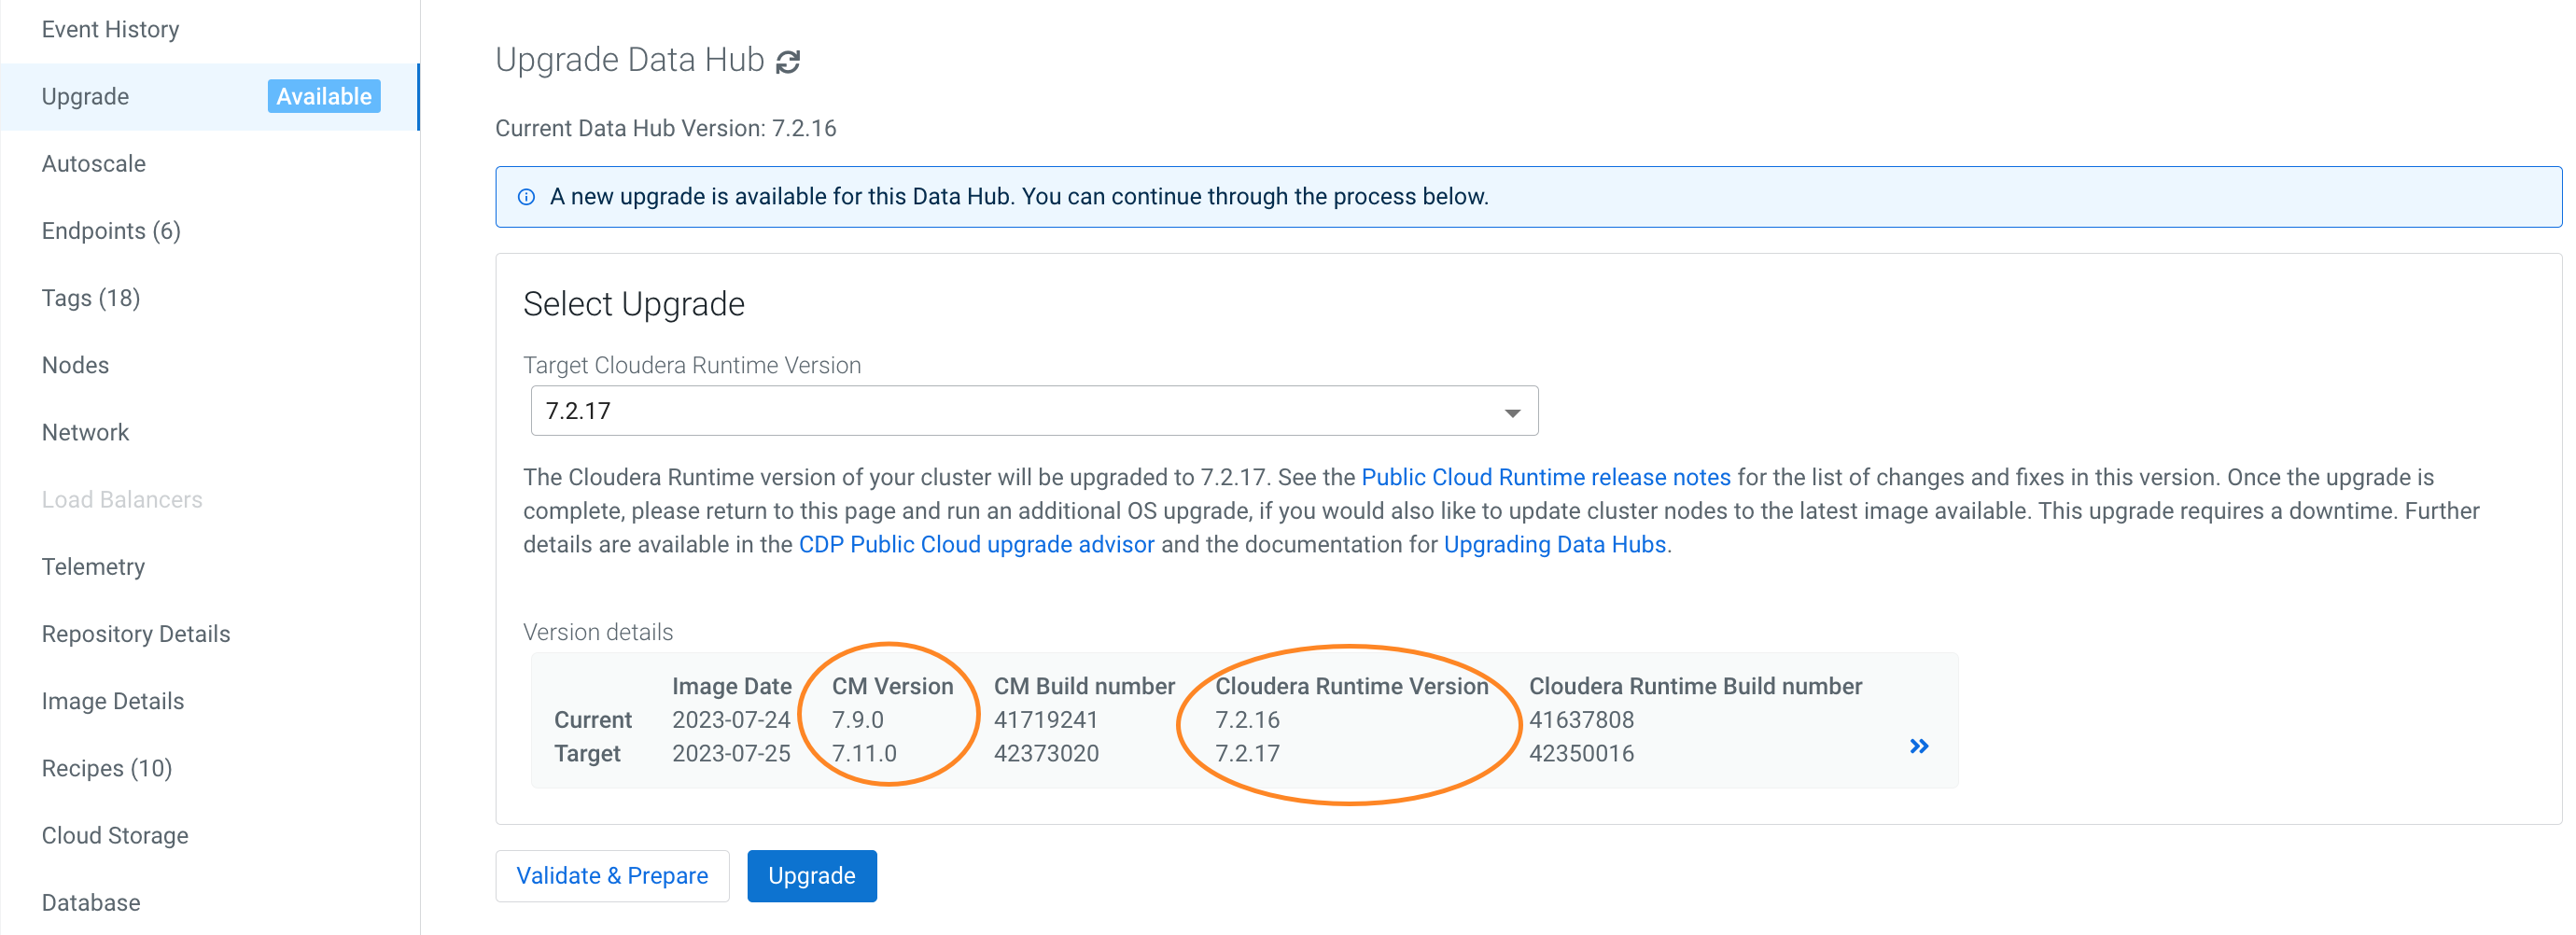
  7. Upgrade the cluster. To upgrade the cluster with the UI:
    1. In the left-hand menu, click Data Hubs and then select the Data Hub to upgrade.
    2. Scroll to the bottom of the Data Hub details page and select the Upgrade tab.
    3. From the drop-down menu, select the Target Runtime Version.
    4. If a rolling upgrade is available, select the Perform rolling upgrade checkbox if you would like to perform this type of upgrade. The availability of a rolling upgrade depends on the current and target Runtime versions, the Data Hub template, and the Data Hub OS. See Data Hub rolling upgrades for more information.
    5. Click Validate and Prepare to check for any configuration issues and begin the Cloudera Runtime parcel download and distribution. Using the validate and prepare option does not require downtime and makes the maintenance window for an upgrade shorter. Validate and prepare also does not make any changes to your cluster and can be run independently of the upgrade itself. Although you can begin the upgrade without first running the validate and prepare option, using it will make the process smoother and the downtime shorter.
    6. When the validate and prepare process is complete, click Upgrade.
  8. Monitor the upgrade progress using the Data Hub Event History tab.
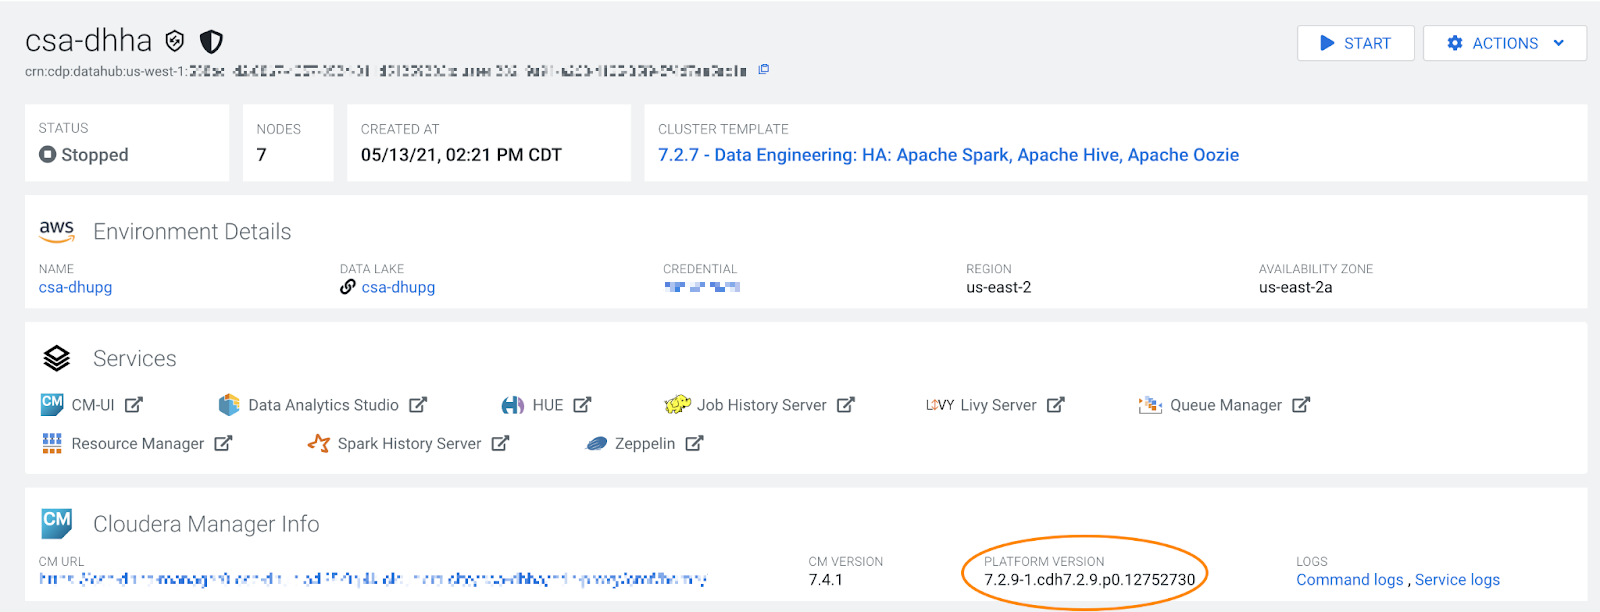
  9. When the upgrade is complete, verify the new version. Note that the new version is reflected in the Platform Version, and not the version displayed in the cluster template name (which will remain the same):
  10. If you disabled autoscaling on the cluster, you can re-enable it after upgrade.
If the upgrade is successful, proceed to the topic Post-upgrade tasks. If the upgrade fails, check the Troubleshooting section and re-try the upgrade.

Post-upgrade tasks

After a successful major/minor version upgrade, complete the following tasks if they apply to the cluster you upgraded.

Flow Management clusters

If doing a software-only upgrade for your Flow Management Data Hub clusters and later repairing one of the NiFi nodes after the upgrade, you may be in a situation where the JDK used by NiFi is not the same across the nodes. This may cause issues in the NiFi UI and you may get an "Unexpected error" message.

After you upgrade a Flow Management cluster and repair a node, ensure that the same JDK is used across the NiFi nodes and if there is a JDK version mismatch, manually upgrade the JDK to match the JDK version being installed on the node that has been repaired.

Data Engineering upgrades to 7.2.11

Upgrading a cluster with the Spark service from Runtime version 7.2.6 or 7.2.7 to version 7.2.11 may cause Spark cluster mode to fail. To workaround this issue, add the following configuration to the /etc/spark/conf/atlas-application.properties file: atlas.kafka.sasl.kerberos.service.name=kafka

Data Engineering HA/Hue HA

If you upgrade a template (such as Data Engineering HA) that contains Hue in an HA configuration, add the Hue load balancer hostnames to Cloudera Manager configurations: Cloudera Manager > Hue > Configuration > knox_proxyhosts. If you do not, you will experience errors preventing users from logging in.

Streams Messaging clusters

Clusters that contain the Streams Replication Manager service require a configuration change following a successful upgrade from Cloudera Runtime 7.2.11 or lower to 7.2.12 or higher. You must configure SRM to use its latest internal changelog data format and intra cluster hostname format. If this configuration is not completed, the SRM Service will not be able to target multiple clusters.

This post upgrade step is required because during an upgrade, SRM is configured to use a legacy version of its changelog data format and intra cluster hostname format. This is done to ensure backward compatibility so that if necessary, a rollback is possible.

Complete the following steps:

  1. Verify that the SRM Service is up and running. This can be done by testing the REST API endpoints using the Swagger UI. If there are any issues, and a rollback is necessary, complete the rollback. No backward incompatible changes occurred up until this point.
  2. In Cloudera Manager, select the Streams Replication Manager service.
  3. Go to Configuration.
  4. Find and disable the following properties:
    1. Use Legacy Internal Changelog Data Format
    2. Use Legacy Intra Cluster Host Name Format
  5. Restart Streams Replication Manager.

Configure Schema Registry to use V2 of its fingerprinting mechanism after upgrade to 7.2.18:

Following an upgrade to Runtime 7.2.18 or later, Cloudera recommends that you configure Schema Registry to use fingerprinting V2. Fingerprinting V2 resolves an issue in V1 where schemas were not created under certain circumstances. For more information on the original issues as well as Schema Registry fingerprinting, see TSB-713. Note that even if you switch to V2, some issues might still persist, see TSB-718 for more information.

  1. Access the Cloudera Manager instance managing your Data Hub cluster.
  2. Select the Schema Registry service and go to Configuration.
  3. Set the Fingerprint Version property to VERSION_2.
  4. Select Actions>Regenerate Fingerprints.
  5. Click Regenerate Fingerprints to start the action.
  6. Restart Schema Registry.

Adding configs manually

The major/minor Runtime upgrade does not install additional configs available in the newer versions of the Data Engineering cluster templates. This topic contains a list of configs added over different template versions. Use the CM UI to add them manually, if the config doesn’t already exist.

  • Clusters -> HDFS -> Configuration:
    hdfs_verify_ec_with_topology_enabled=false
    erasure_coding_default_policy=” “
    
  • Clusters -> HDFS -> Configuration -> Cluster-wide Advanced Configuration Snippet (Safety Valve) for core-site.xml:
    fs.s3a.buffer.dir=${env.LOCAL_DIRS:-${hadoop.tmp.dir}}/s3a
    HADOOP_OPTS="-Dorg.wildfly.openssl.path=/usr/lib64 ${HADOOP_OPTS}"
    
  • Clusters -> Yarn -> Configuration:
    yarn_admin_acl=yarn,hive,hdfs,mapred
  • Clusters -> Yarn -> Configuration -> YARN Service MapReduce Advanced Configuration Snippet (Safety Valve):
    mapreduce.fileoutputcommitter.algorithm.version=1
    mapreduce.input.fileinputformat.list-status.num-threads=100
    
  • Clusters -> Tez -> Configuration:
    tez.grouping.split-waves=1.4
    tez.grouping.min-size=268435456
    tez.grouping.max-size=268435456
    
  • Clusters -> Tez -> Configuration -> Tez Client Advanced Configuration Snippet (Safety Valve) for tez-conf/tez-site.xml:
    tez.runtime.pipelined.sorter.lazy-allocate.memory=true
  • Clusters -> Hive -> Configuration -> Hive Service Advanced Configuration Snippet (Safety Valve) for hive-site.xml:
    fs.s3a.ssl.channel.mode=openssl
    hive.txn.acid.dir.cache.duration=0
    hive.server2.tez.session.lifetime=30m
    hive.blobstore.supported.schemes=s3,s3a,s3n,abfs,gs
    hive.orc.splits.include.fileid=false
    hive.hook.proto.events.clean.freq=1h
    hive.metastore.try.direct.sql.ddl=true
    hive.privilege.synchronizer=false
    
  • Clusters -> Hive -> Configuration:
    hiveserver2_idle_session_timeout=14400000
  • spark_on_yarn -> Configuration -> Spark Client Advanced Configuration Snippet (Safety Valve) for spark-conf/spark-defaults.conf:
    spark.hadoop.mapreduce.fileoutputcommitter.algorithm.version=1
    spark.hadoop.fs.s3a.ssl.channel.mode=openssl
    
  • Clusters -> Hive Metastore -> Configuration -> Hive Metastore Server Advanced Configuration Snippet (Safety Valve) for hive-site.xml
    hive.metastore.try.direct.sql.ddl=true
  • Clusters -> <your cluster name> -> Configuration -> Suppressed Health and Configuration Issues:
    role_config_suppression_namenode_java_heapsize_minimum_validator=true