using analytic functionsPDF version

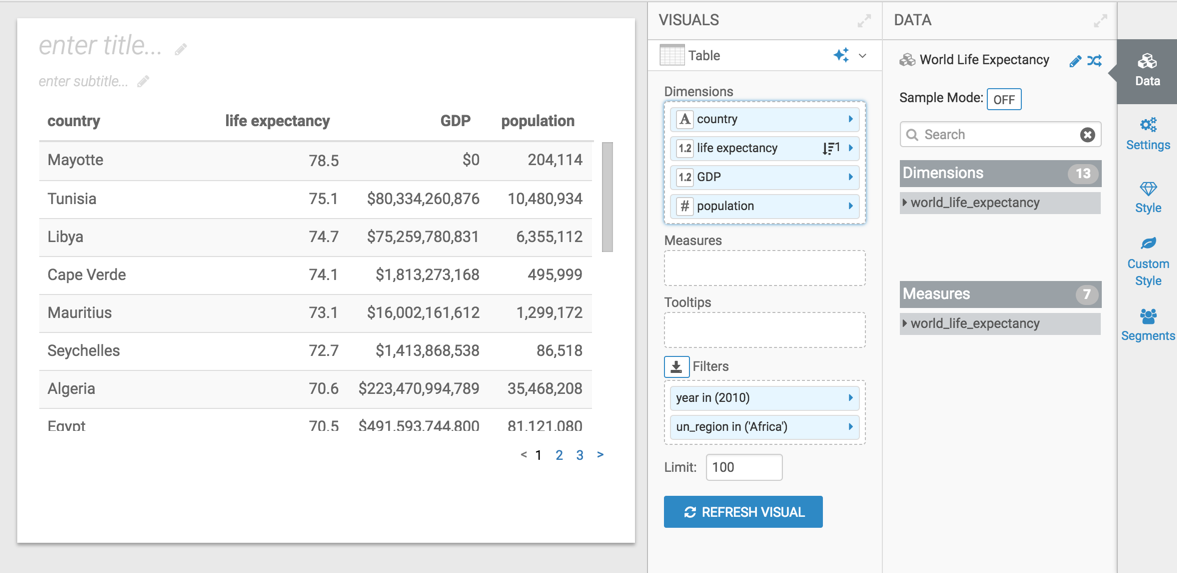
Setting up a basic visual for single values

  1. Open a new visual.
  2. In the Visuals menu, select the Table visual type.
  3. Populate the shelves of the visual from the fields listed in the Data menu:
    • Dimensions

      Add the fields country, life_expectancy, gdp_per_capita, and population.

    • Filters

      Add the field year, and select the value 2010.

      Add the field un_subregion, and set it to Africa.

  4. Specify descending order on life_expectancy.
  5. Optional: In the Enter/Edit Expression editor, change the gdp_per_capita calculation on the shelf, and rename it:[gdp_per_capita]*[population] as 'GDP'
  6. Optional: Change the Display Format options for the fields on the shelves to remove extra decimals, specify currency, and so on.
  7. Optional: Change the Alias for the fields on the shelves. Click Refresh Visual to update the table visual.
  8. Name the visual Basic Table.
  9. Click Save.

We want your opinion

How can we improve this page?

What kind of feedback do you have?