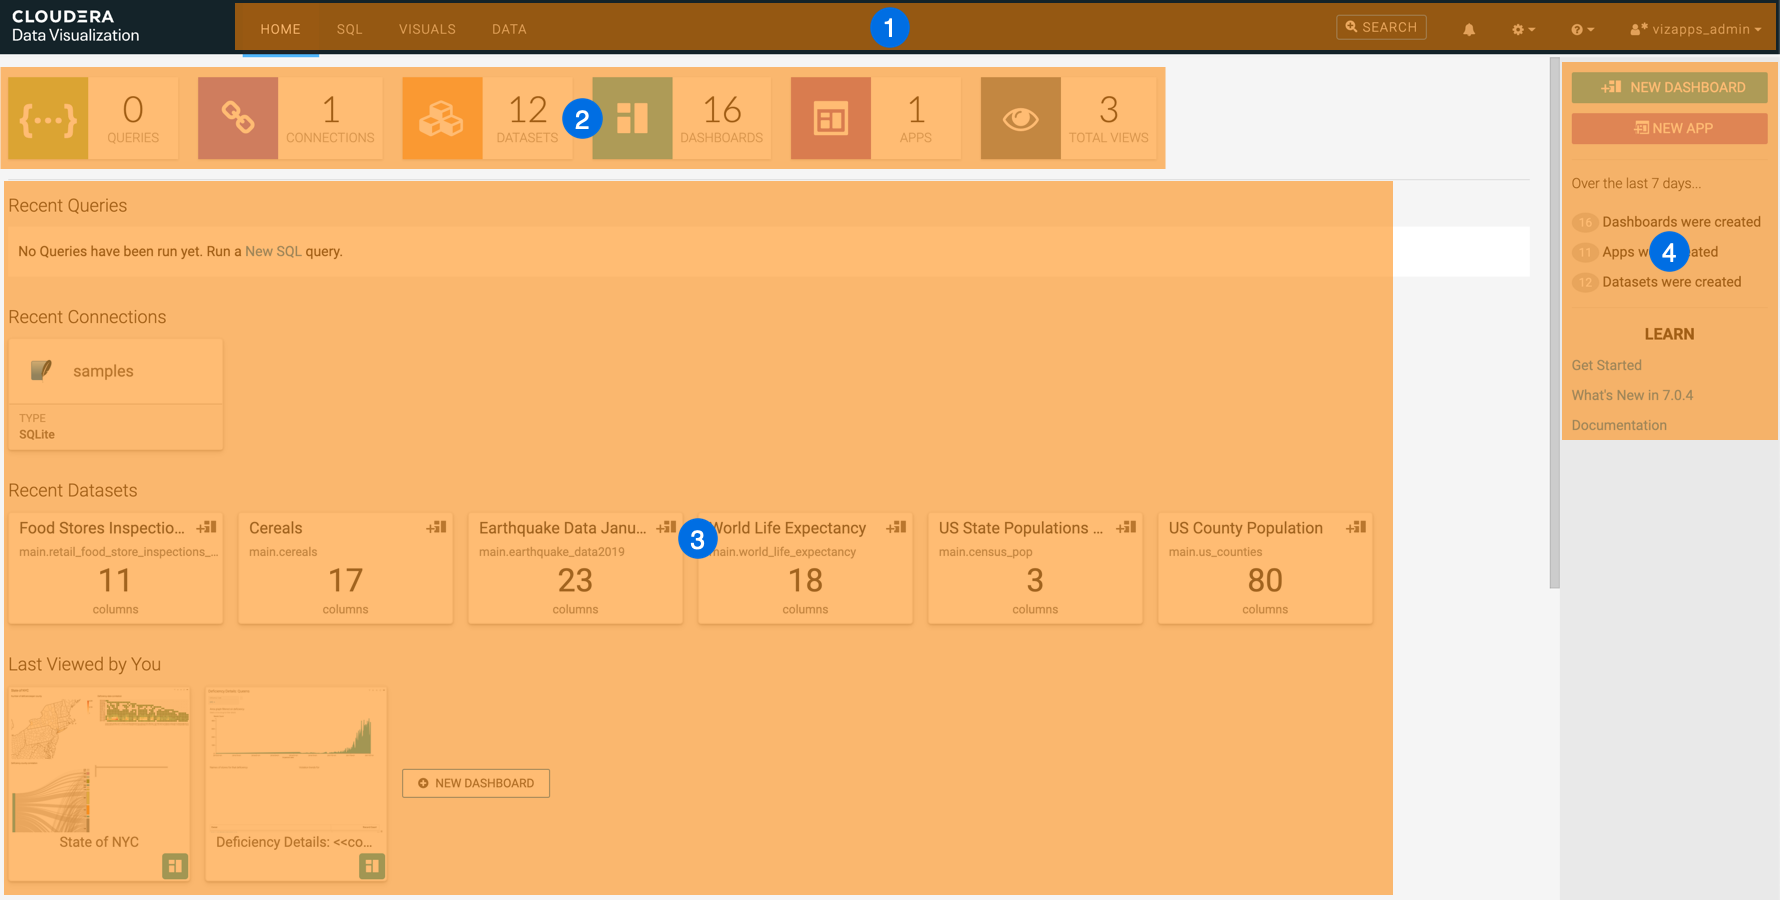
Cloudera Data Visualization, HOME view
The web interface of Cloudera Data Visualization has four views: HOME, SQL, VISUALS, and DATA. When you log in, you land on the HOME view.
This page is the starting point for working in Cloudera Data Visualization. It provides an overview of your environment and quick access to recently used content, favorite items, and commonly used actions.
What users can see and access in the UI is determined by their role and permissions.
To return to this homepage at any time, click HOME in the main navigation bar.
The default homepage consists of the following areas:
- Statistics banner
- Preview area
- Home page side menu
For information on customizing the Cloudera Data Visualization homepage, see Custom Homepages.
Statistics banner
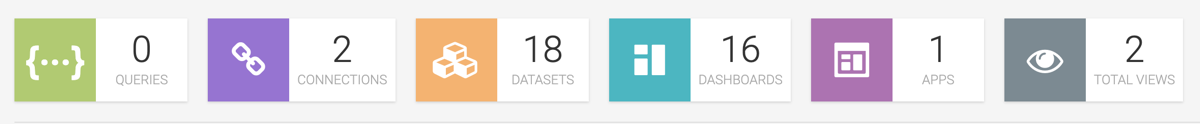
The statistics banner provides a high-level overview of the content available in your Cloudera Data Visualization environment.
- Queries
- Connections
- Datasets
- Dashboards
- Applications
- Total Views
Click a tile to explore the corresponding content. For example, you can view available datasets, connections, dashboards, or applications that you have permission to access.
If you click TOTAL VIEWS, you are directed to the Daily Usage tab of the Activity Log interface, where you can check the list of all activities, users, and dashboards in your Cloudera Data Visualization instance. You can adjust the time interval you want to review (the default is 30 days), and you can download the data in CSV format.
Preview area
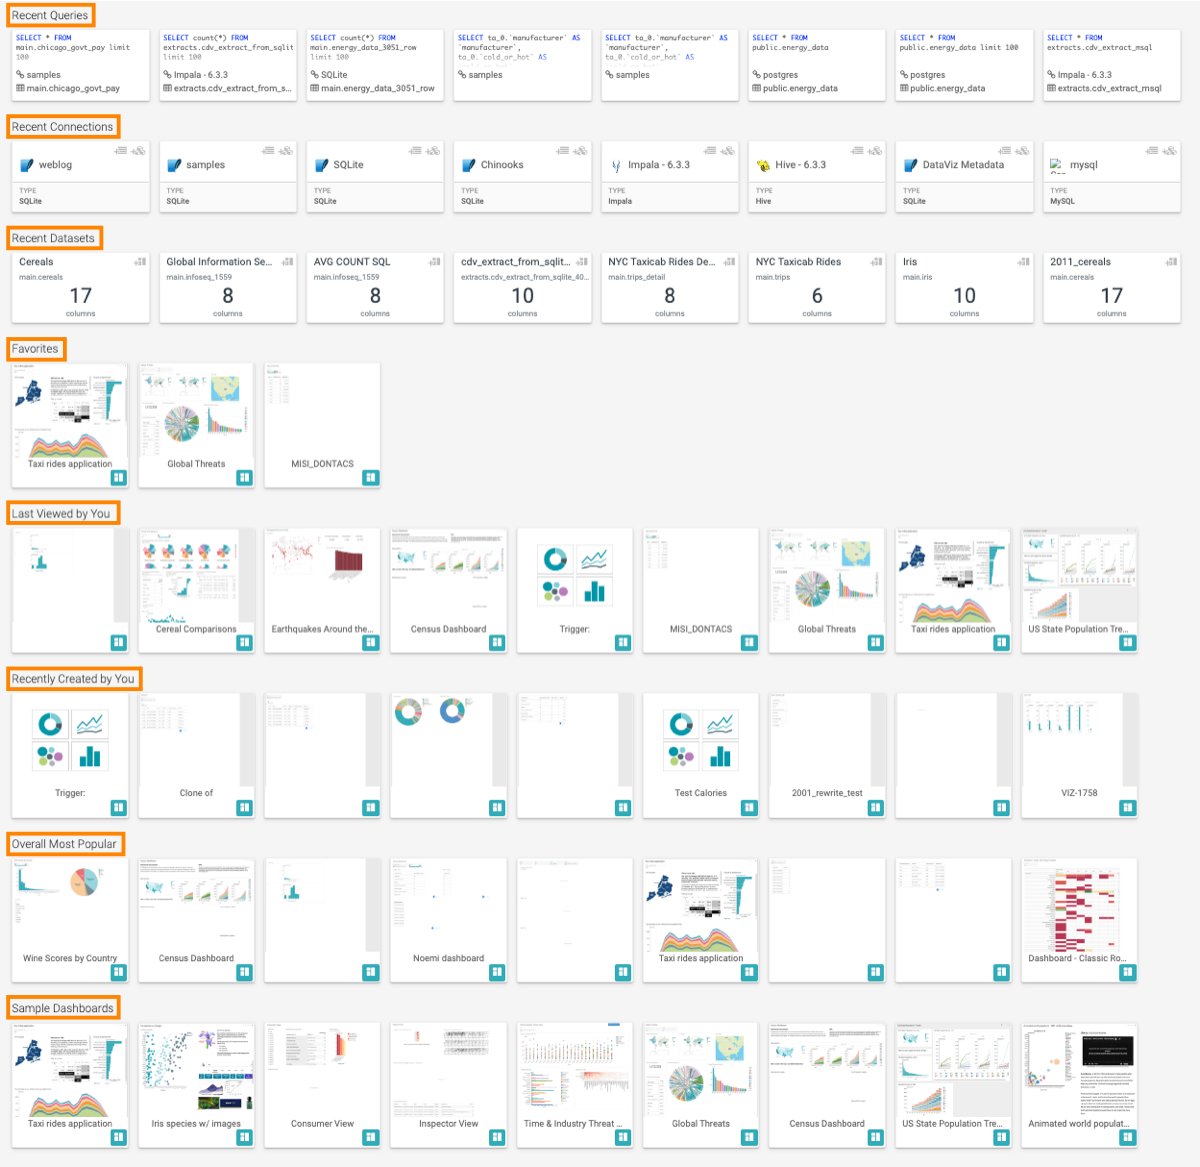
The preview area provides quick access to content you recently worked with or may want to revisit.
Depending on your permissions and activity, the preview area can display:
- Recent queries
- Recent connections
- Recent datasets
- Favorites
- Recently viewed items
- Recently created items
- Popular content
- Sample dashboards
Click a tile to open the selected item.
Connection tiles include shortcuts for adding data and creating datasets. Dataset tiles include a shortcut for creating a dashboard based on the selected dataset.
Homepage side menu
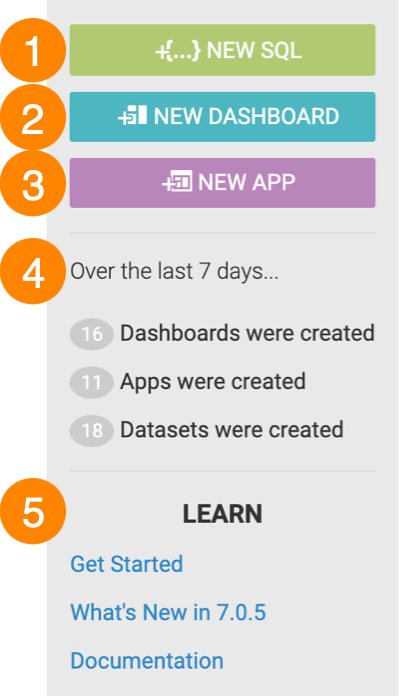
The side menu provides shortcuts for creating content and accessing learning resources.
- Create
-
This section provides entry points to the main content creation workflows.
- NEW SQL: Opens the SQL editor in the Data Connection interface, where you can create and run SQL queries. This option is available only if Direct Access is enabled and you have the required permissions on at least one data connection.
- NEW DASHBOARD: Opens the Dashboard Designer where you can create new dashboards and visuals.
- NEW APP: Opens the App Designer where you can build applications from existing dashboards and visualizations.
- 4. Activity summary
-
The Over the last 7 days... section displays the number of dashboards, applications, and datasets created during the previous seven days.
- 5. Learn
-
This section provides access to information resources about the product:
- Get Started: Opens the in-product getting started guide.
- What's New in: Displays information about new features and enhancements.
- Documentation: Opens the product documentation.