Managing the Cloudera Data Science Workbench Service in Cloudera Manager
This topic describes how to configure and manage Cloudera Data Science Workbench using Cloudera Manager. The contents of this topic only apply to CSD-based deployments. If you installed Cloudera Data Science Workbench using the RPM, the Cloudera Data Science Workbench service will not be available to you in Cloudera Manager.
- Adding the Cloudera Data Science Workbench Service
- Accessing Cloudera Data Science Workbench from Cloudera Manager
- Configuring Cloudera Data Science Workbench Properties
- Starting, Stopping, and Restarting the Service
- Reserving the Master Host for Internal CDSW Components
- Managing Cloudera Data Science Workbench Worker Hosts
- Health Tests
- Tracking Disk Usage on the Application Block Device
- Creating Diagnostic Bundles
Adding the Cloudera Data Science Workbench Service
Cloudera Data Science Workbench is available as an add-on service for Cloudera Manager. To install Cloudera Data Science Workbench, you require the following files: a CSD JAR file that contains all the configuration needed to describe and manage the new Cloudera Data Science Workbench service, and the Cloudera Data Science Workbench parcel.
To install this service, first download and copy the CSD file to the Cloudera Manager Server host. Then use Cloudera Manager to distribute the Cloudera Data Science Workbench parcel to the relevant gateway nodes. You can then use Cloudera Manager's Add Service wizard to add the Cloudera Data Science Workbench service to your cluster.
For the complete set of instructions, see Install Cloudera Data Science Workbench.
Accessing Cloudera Data Science Workbench from Cloudera Manager
- Log into the Cloudera Manager Admin Console.
- Go to the CDSW service.
- Click CDSW Web UI to visit the Cloudera Data Science Workbench web application.
Configuring Cloudera Data Science Workbench Properties
In a CSD-based deployment, Cloudera Manager allows you to configure Cloudera Data Science Workbench properties without having to directly edit any configuration file.
- Log into the Cloudera Manager Admin Console.
- Go to the CDSW service.
- Click the Configuration tab.
- Use the search bar to look for the property you want to configure. You can use Cloudera Manager to configure proxies, enable TLS, reserve the master node, and enable GPU support for Cloudera Data Science Workbench.
If you have recently upgraded to a CSD-based deployment, a list of the properties in cdsw.conf, along with their corresponding properties in Cloudera Manager can be found in the upgrade guide here.
- Click Save Changes.
Starting, Stopping, and Restarting the Service
- Log into the Cloudera Manager Admin Console.
- On the tab, click
 to the right of the CDSW service and select the action (Start,
Stop, or Restart) you want to perform from the dropdown.
to the right of the CDSW service and select the action (Start,
Stop, or Restart) you want to perform from the dropdown. - Confirm your choice on the next screen. When you see a Finished status, the action is complete.
Points to Remember
-
After a restart, the Cloudera Data Science Workbench service in Cloudera Manager will display Good health even though the Cloudera Data Science Workbench web application might need a few more minutes to get ready to serve requests.
-
The CDSW service must be restarted every time client configuration is redeployed to the Cloudera Data Science Workbench hosts.
Reserving the Master Host for Internal CDSW Components
Starting with version 1.4.3, Cloudera Data Science Workbench allows you to reserve the master node for running internal application components and services such as Livelog, the PostgreSQL database, and so on, while user workloads run exclusively on worker nodes.
By default, the master node runs both, user workloads as well as the application's internal services. However, depending on the size of your CDSW deployment and the number of workloads running at any given time, it's possible that user workloads might dominate resources on the master node. Enabling this feature will ensure that CDSW's application components always have access to the resources they need on the master node and are not adversely affected by user workloads.
Depending on your deployment type, use one of the following sets of instructions to enable this feature:
RPM Deployments
To enable this feature on RPM-based deployments, go to the /etc/cdsw/config/cdsw.conf file and set the RESERVE_MASTER property to true.
CSD Deployments
On CSD-based deployments, this feature can be enabled in Cloudera Manager. Note that this feature is not yet available as a configuration property in Cloudera Manager. However, you can use an Advanced Configuration Snippet (Safety Valve) to configure this as follows:
- Log into the Cloudera Manager Admin Console.
- Go to the CDSW service.
- Click the Configuration tab.
- Use the search bar to look for the Master Advanced Configuration Snippet (Safety Valve) for cdsw.properties property. Add the following string to the
value field:
RESERVE_MASTER=true
- Click Save Changes.
- Restart the CDSW service to have this change go into effect.
Managing Cloudera Data Science Workbench Worker Hosts
Health Tests
Cloudera Manager runs a few health tests to confirm whether Cloudera Data Science Workbench and it's components (Master and Workers) are running, and ready to serve requests.
You can choose to enable or disable individual or summary health tests, and in some cases specify what should be included in the calculation of overall health for the service, role instance, or host. See Configuring Monitoring Settings for more information.
Tracking Disk Usage on the Application Block Device
This section demonstrates how to use Cloudera Manager to chart disk usage on the Application block device over time, and to create a trigger to notify cluster administrators when free space on the block device falls below a certain threshold. The latter is particularly important because once the Application block device runs out of memory, Cloudera Data Science Workbench will stop launching any new sessions or jobs. Advance notifications will give administrators a chance to expand the block device or cleanup existing data before Cloudera Data Science Workbench users run into any problems.
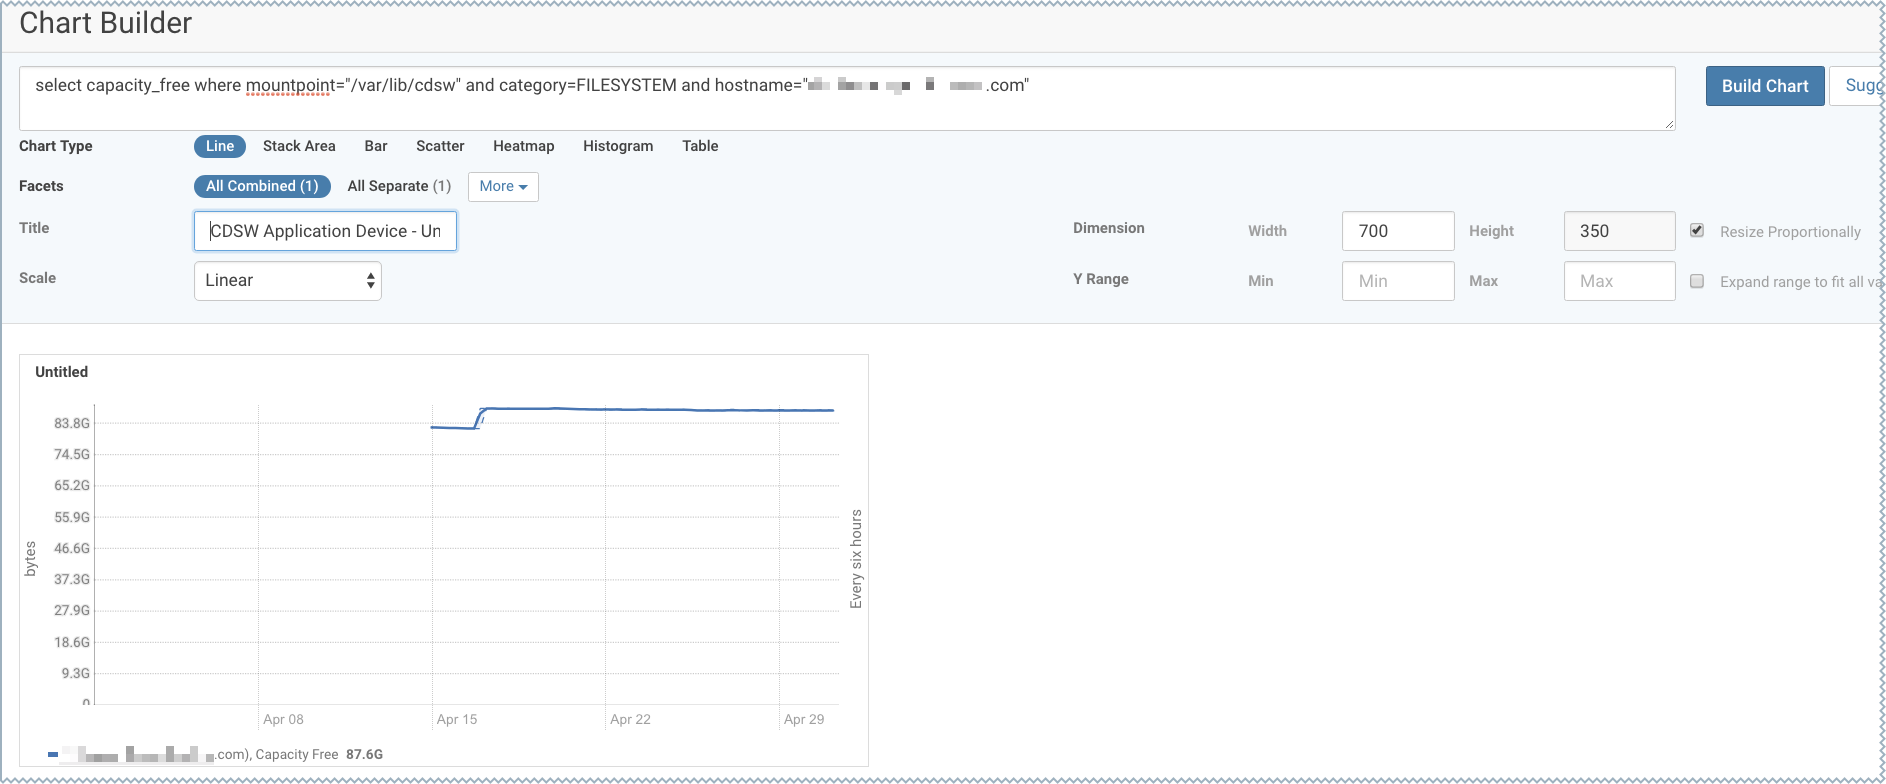
Create a Chart to Track Disk Usage on the Application Block Device
- Log into the Cloudera Manager Admin Console.
- Click .
- Enter a tsquery that charts memory
usage on the block device. For example, the following tsquery creates a chart to track unallocated memory on the Application block device.
select capacity_free where mountpoint="/var/lib/cdsw" and category=FILESYSTEM and hostname="<CDSW_Master_hostname>"
Alternatively, you could use the following tsquery to track the amount of memory already in use on the block device.Make sure you insert the hostname for your master node as indicated in the queries.select capacity, capacity_used where mountpoint="/var/lib/cdsw" and category=FILESYSTEM and hostname="<CDSW_Master_hostname>"
-
Click Build Chart. You should see a preview of the chart below.
- Click Save.
- Enter a name for the chart.
- Select Add chart to another dashboard. From the dropdown list of available System Dashboards, select CDH Cloudera Data Science Workbench Status Page.
-
Click Save Chart. If you navigate back to the CDSW service page, you should now see the new chart on this page.
For more details about Cloudera Manager's Chart Builder, see the following topic in the Cloudera Manager documentation: Charting Time Series Data.
Create a Trigger to Notify Cluster Administrators when Free Space Runs Low
- Log in to Cloudera Manager and go to the CDSW service page.
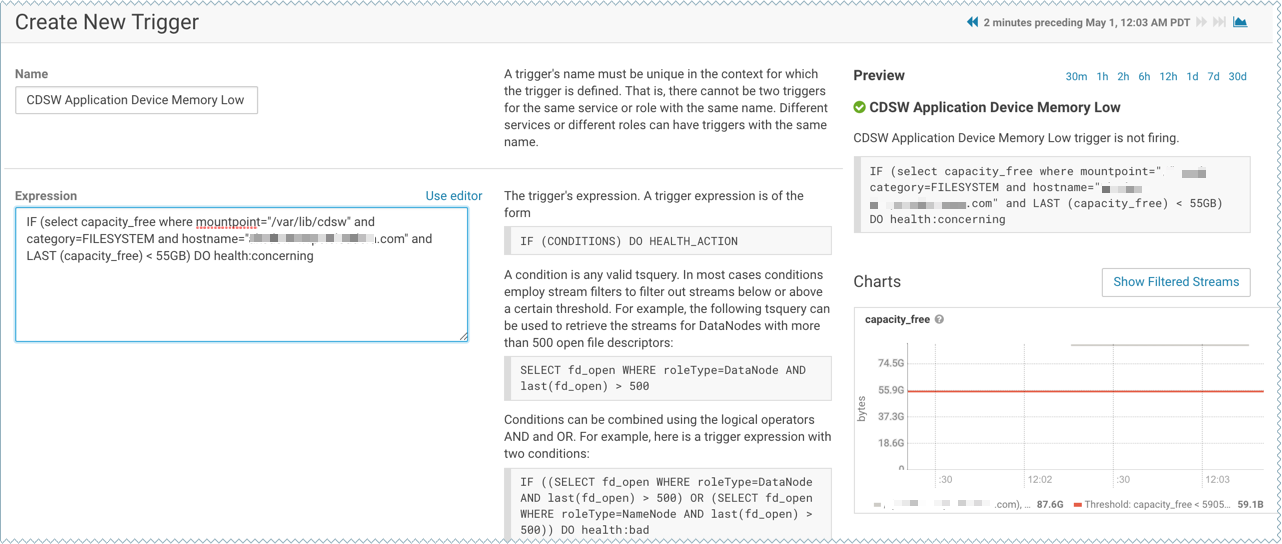
- Click Create Trigger.
- Give the trigger a name.
-
Modify the Expression field to include a condition for the trigger to fire. For example, if the trigger should fire when unallocated memory on the Application Block Device falls below 250GB, the expression should be:
IF (select capacity_free where mountpoint="/var/lib/cdsw" and category=FILESYSTEM and hostname="<CDSW_Master_hostname>" and LAST (capacity_free) < 250GB) DO health:concerning
On the right hand side of the page, you should see a preview of the query you have entered and a chart that displays the result of the query as in the following sample image. Note that if the query is incorrect or incomplete you will not see the preview on the right.
-
Click Create Trigger. If you navigate back to the CDSW service page, you should now see the new trigger in the list of Health Tests.
For more details about Triggers, refer the following topic in the Cloudera Manager documentation: Triggers.
Creating Diagnostic Bundles
Diagnostic data for Cloudera Data Science Workbench is now available as part of the Cloudera Manager diagnostic bundle. For details on usage and diagnostic data collection in Cloudera Data Science Workbench, see Data Collection in Cloudera Data Science Workbench.