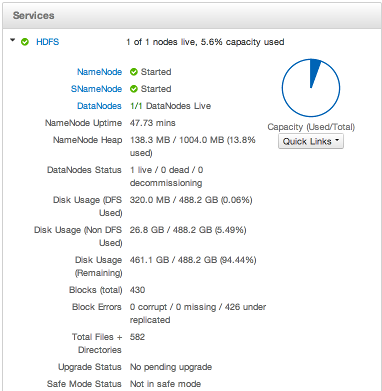
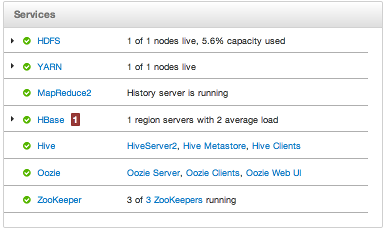
Notice the color of the dot appearing next to each service name in the list of Services . The dot color and blinking action indicates operating status of each service. For example, in the Classic Dashboard image, notice the green dots next to HDFS, YARN, MapReduce2, Hive, Oozie, and Zookeeper. Notice the red dot next to HBase. The following colors and actions indicate service status:
Table 2.5. Service Status Indicators
| Color | Action | Status |
|---|---|---|
 | Solid Green | All masters are running |
 | Blinking Green | Starting up |
 | Solid Red | At least one master is down |
 | Blinking Red | Stopping |
Notice also in the Classic Dashboard image, the small triangles next to HDFS, YARN, and HBase services. These triangles point to services deployed in master/slave sets. Select the triangle to open a panel showing more detailed status information about the service.

Notice especially a small, red, numbered rectangle, such as the following example highlighted blue, appearing next to a service name.
A red, numbered rectangle shows how many current alerts a service generates, indicating necessary actions.

Select a service name to open a more detailed Services screen that displays more detailed alert information.

