
On the right side of the screen is the Cluster Metrics section. This section gives you charts for a snapshot of the important cluster-wide metrics: Network Usage, Cluster Load, Memory Usage, and CPU Usage. To see a legend for the chart, hover over it. To remove a metric from the chart, click on the legend in the metric to remove the checkmark and deselect it.
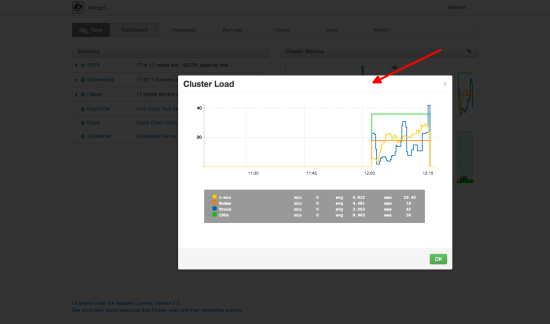
To see a larger view of the chart, click the chart. Ambari displays a larger version of the chart in a pop-out window.
Notice the link symbol on the upper right side of the Cluster Metric section, outlined in blue in the overview screenshot above. This is a link to the GUI for the Ganglia Server itself, where you can find much more detailed information on your cluster. You can also use this to switch back to the Widget version.
