
2.2. Viewing Grafana Dashboards
To view a dashboard that displays mulitple metrics for an HDP component, select a dashboard name in the Grafana UI. For example:
In Grafana, browse to Dashboards.
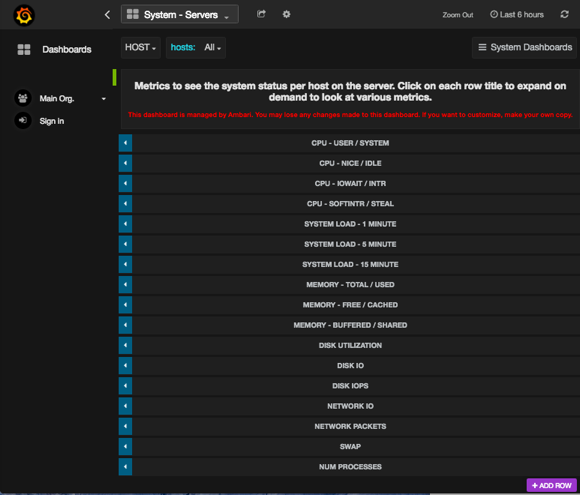
Select System - Servers.
The System - Servers dashboard opens in your browser.