

2.4. Viewing Metrics for Selected Hosts
Grafana shows metrics for all hosts in your cluster by default. You can limit the displayed metrics by selecting one or more host(s) in your cluster, using the Hosts menu.
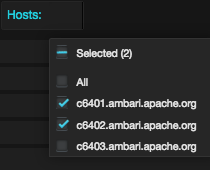
Expand Hosts.
Select one or more host names.
A checkmark appears next to selected host names, as shown in the following example:
![[Note]](../common/images/admon/note.png) | Note |
|---|---|
Selections in Host menu apply to all metrics in the current dashboard. Grafana refreshes the current dashboards when you select a new set of hosts. |