

1. Viewing the Cluster Dashboard
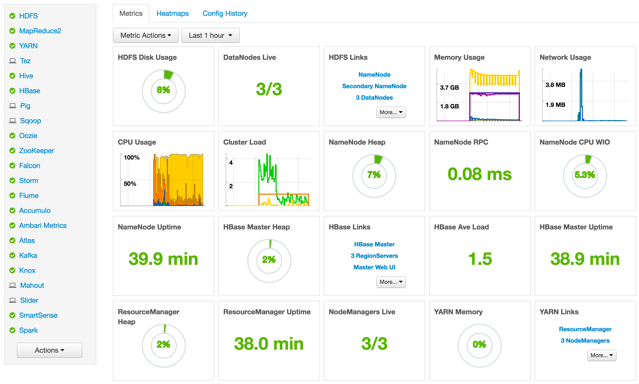
Ambari Web displays the Dashboard page as the home page. Use the Dashboard to view the operating status of your cluster. Each metrics widget displays status information for a single service in your HDP cluster. The Dashboard displays all metrics for the HDFS, YARN, HBase, and Storm services, and cluster-wide metrics by default. You can add and remove individual widgets, and rearrange the Dashboard by dragging and dropping each widget to a new location in the dashboard. Status information appears as simple pie and bar charts, more complex charts showing usage and load, sets of links to additional data sources, and values for operating parameters such as uptime and average RPC queue wait times. Most widgets display a single fact by default. For example, HDFS Disk Usage displays a load chart and a percentage figure.
![[Note]](../common/images/admon/note.png) | Note |
|---|---|
Each Service installed in your cluster also has a Service-specific dashboard. Refer to the Managing Services > Modifying the Service Dashboard section for more information. |