Cloudera Data Catalog Dashboard
The Dashboard provides quick access to vital service information at a glance, in the form of visual, actionable navigation for multiple operations. The user-friendly navigation enables viewing, filtering, and acting upon data quickly and in a simple manner.
Data Stewards can view the Dashboard at a glance, and also focus on the most important tasks, enabling faster decision making as well as immediate action. The application lets you perform multiple actions for different types of content that helps in visualizing information with ease.
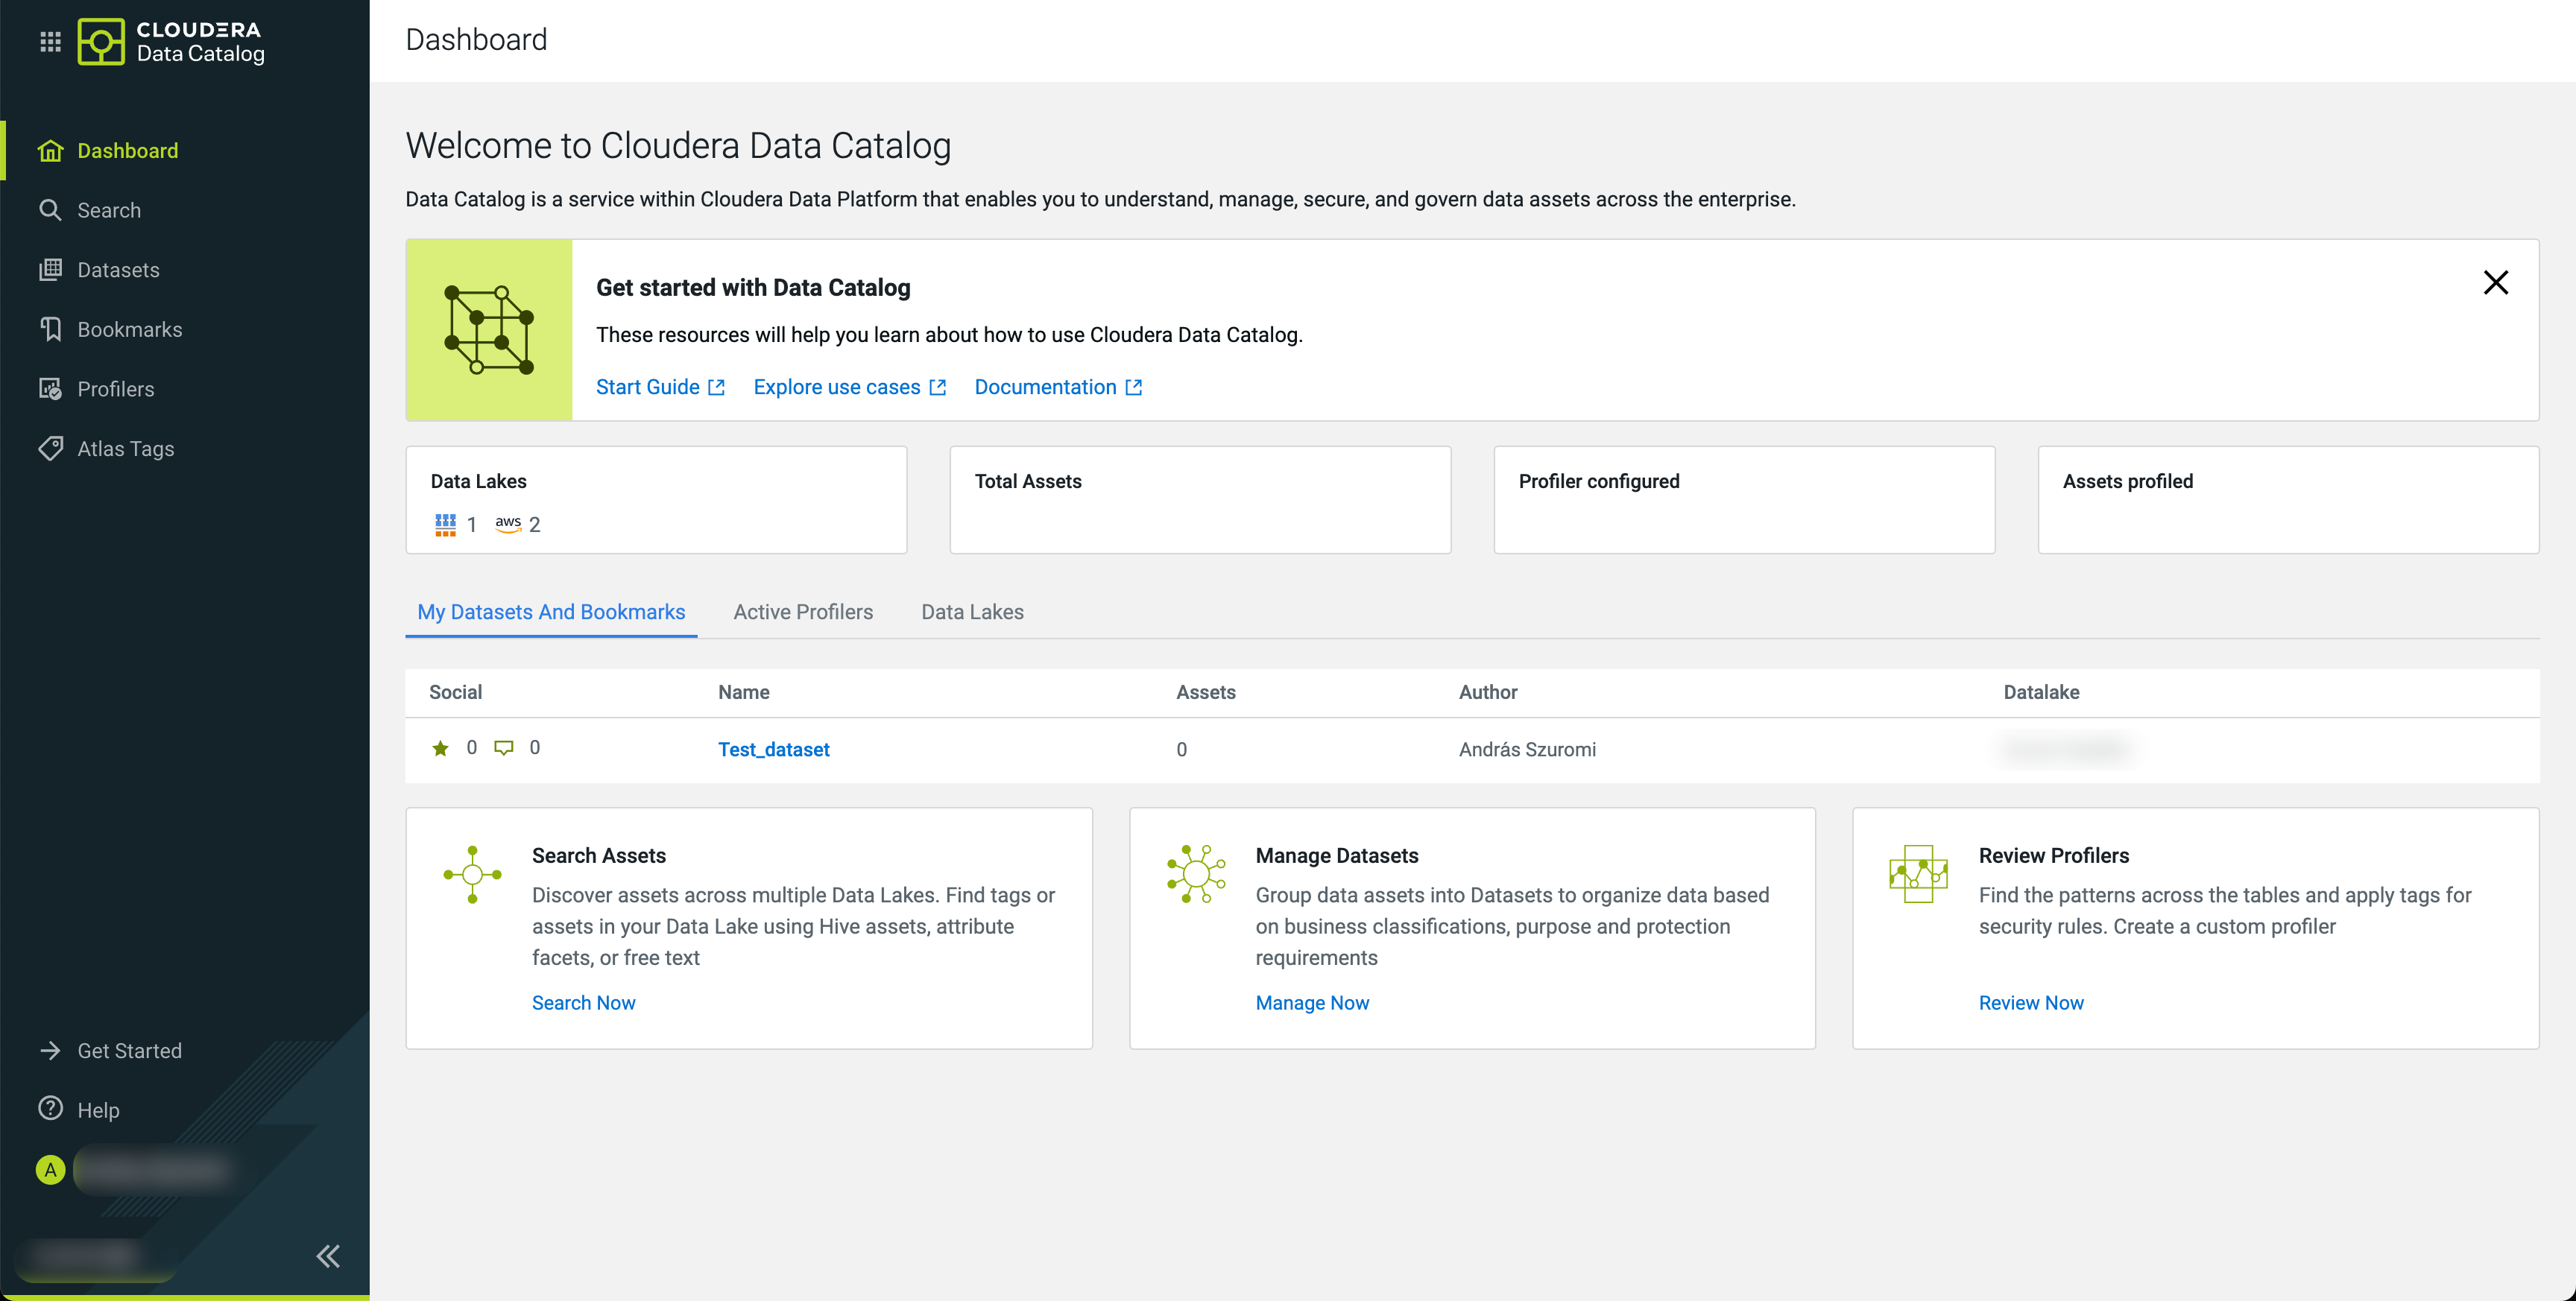
The displayed cards and tabs are fully interactive, with clickable areas for easy navigation
to relevant parts of applications. Users can access individual sections and narrow down the
information displayed. For example, you can manage the datasets created and bookmarked by you.
For more information, see:
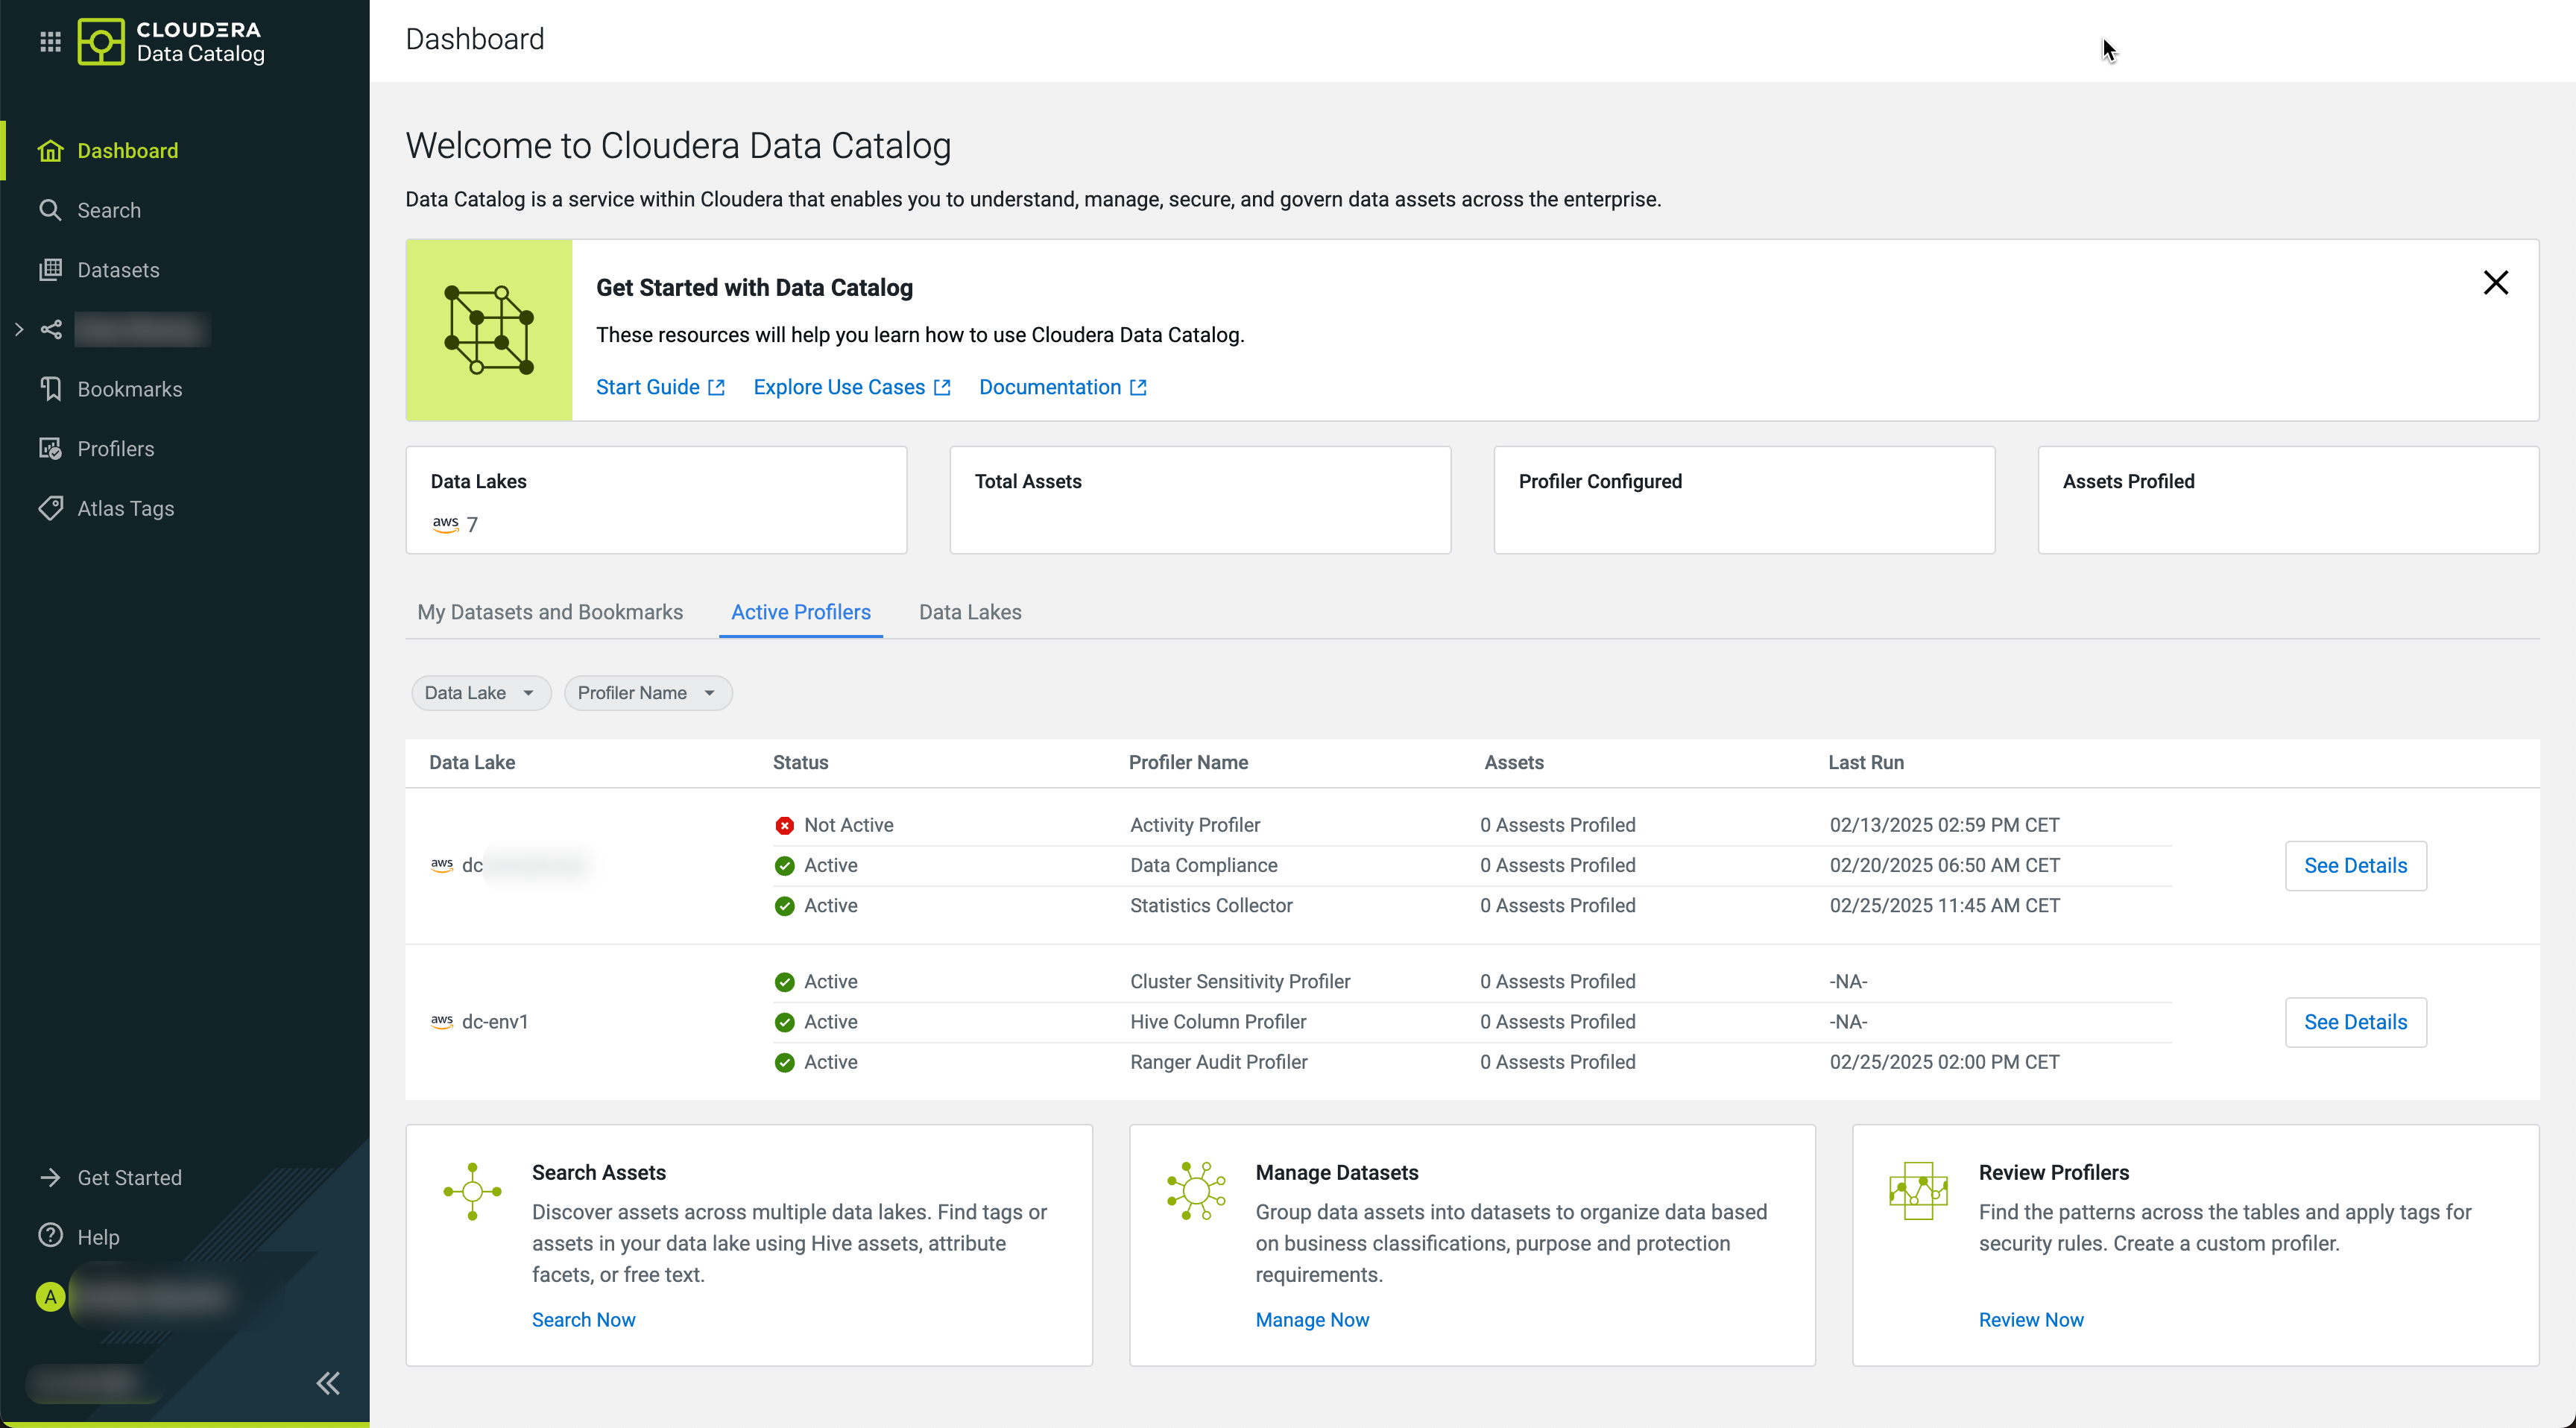
The Dashboard page contains information on your profilers, the total
number of assets that are profiled, along with the assets that are scanned for data. Clicking See
Details leads you to your individual profilers:
- VM-based environments:The Cluster Sensitivity Profiler / Compute cluster enabled environments: The Data Compliance Profiler
- VM-based environments: The Hive Column Profiler / Compute cluster enabled environments: The Statistics Collector Profiler
- VM-based environments: The Ranger Audit Profiler / Compute cluster enabled environments: The Activity Profiler
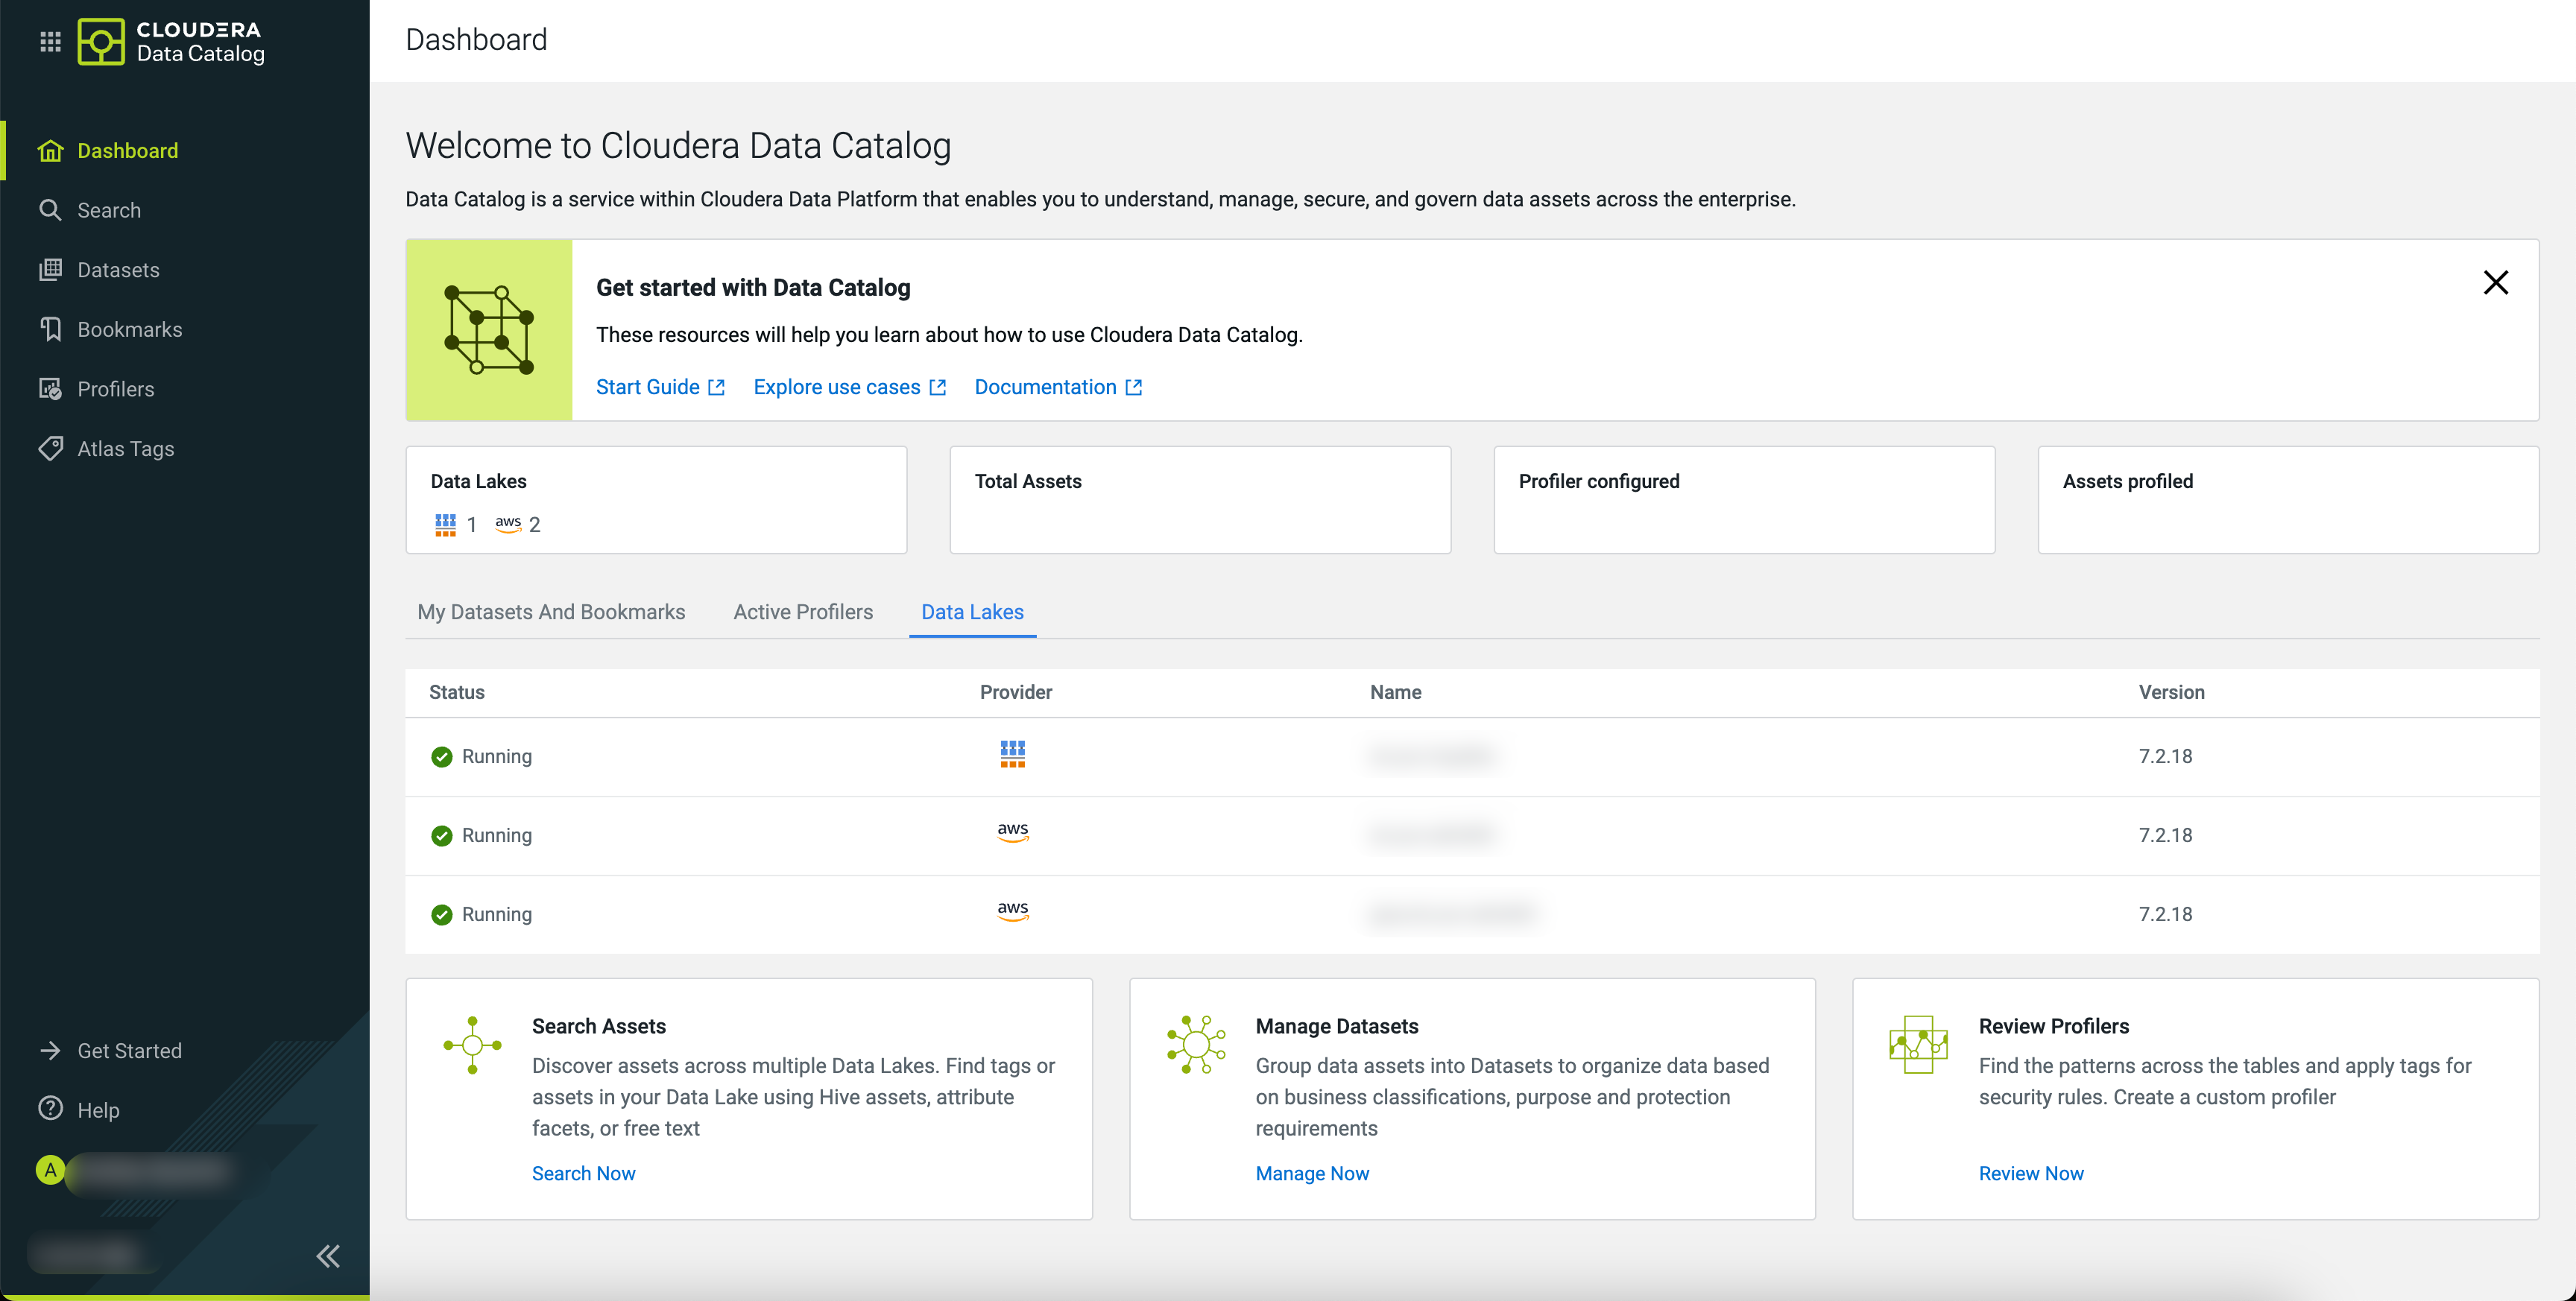
Additionally, you can check the status of your Data Lakes. For more information, see Introduction to Data Lakes.