Before you can use the Cloudera Data Engineering (CDE) service, you
must add the service to an environment that you want to use CDE
on.
Make sure that you have a working environment for which you want to
enable the CDE service. For more information about environments, see
Environments.
-
In the Cloudera Data Platform (CDP) console, click the
Data Engineering tile. The CDE Home page
displays.
-
Click Administration on the left navigation menu, click
 at the top to enable CDE service for an
environment.
If the environment does not have any CDE service, the page displays a
Enable a Service button that launches the same wizard.

-
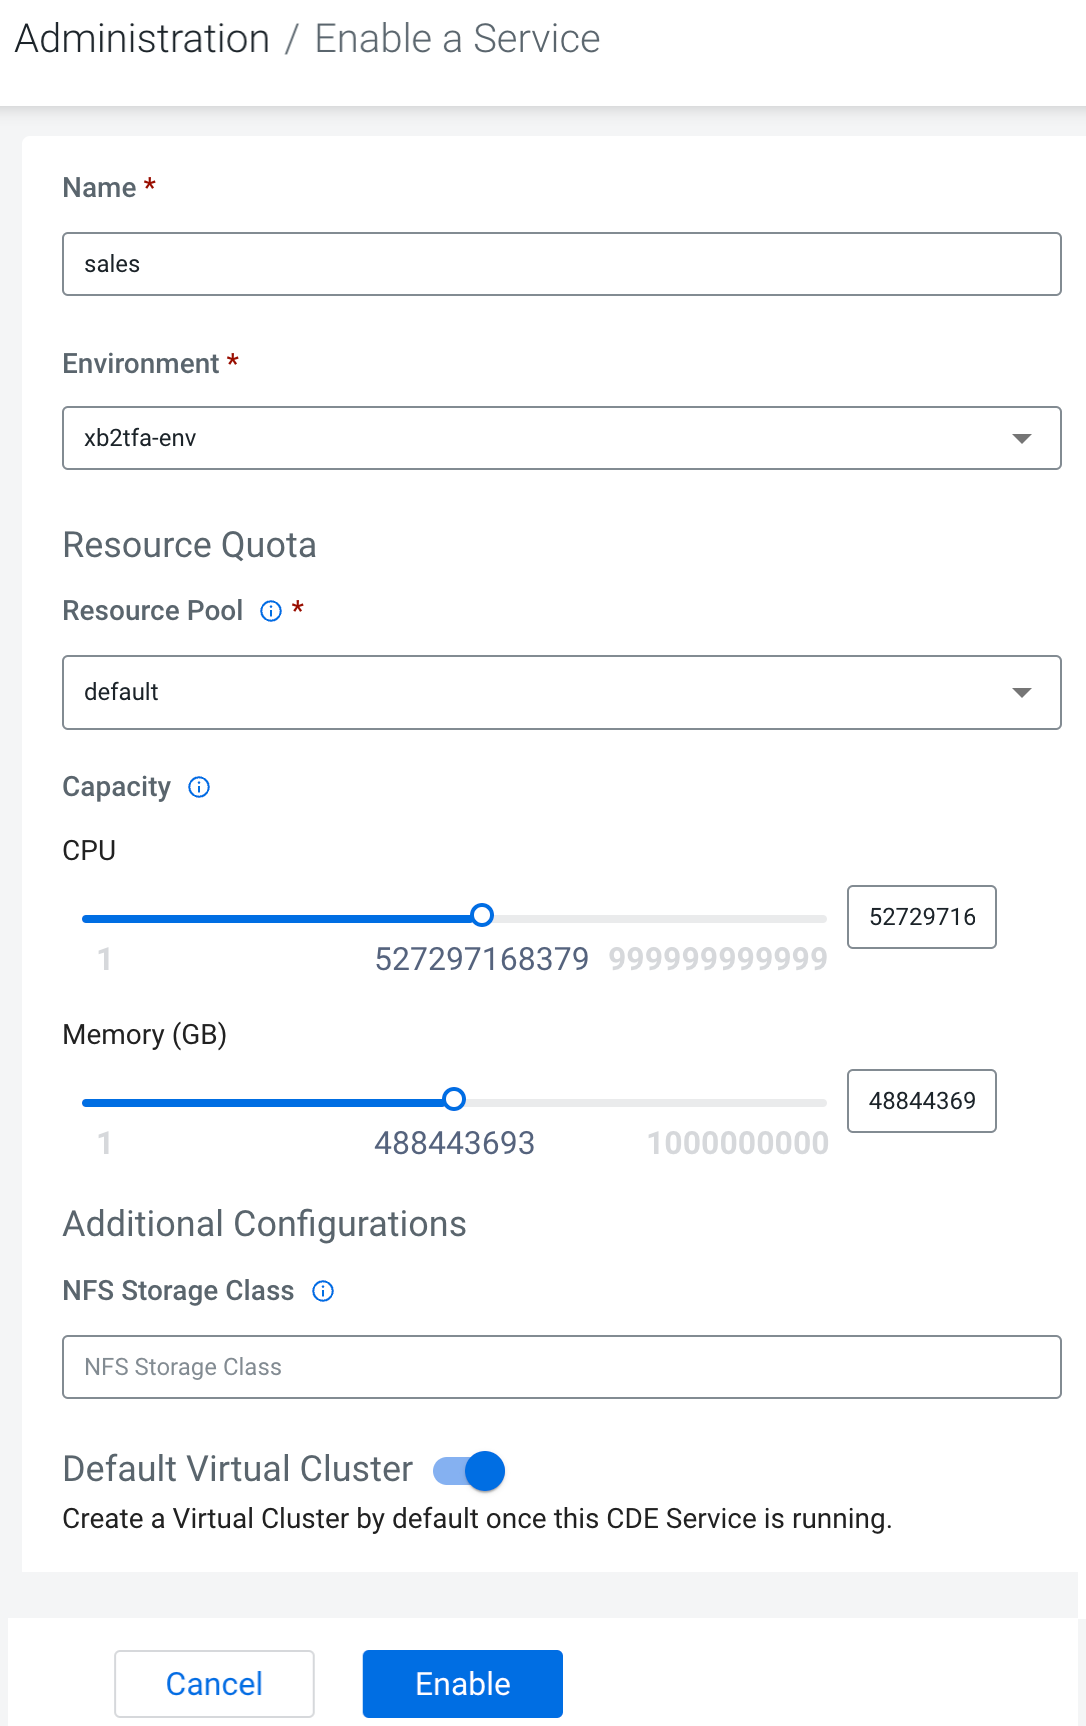
Enter a Name for the CDE service you are creating.
-
In the Environment text box, select or type the name of the
environment that you want to enable CDE for. The displayed list dynamically updates to
show environment names matching your input. When you see the correct environment, click on
it to select it.
-
In Resource Pool (Technical Preview), select the name of the
resource pool that you want to enable CDE service for.
-
In Capacity (Technical Preview), use the slider to set the
maximum number of CPU cores and the maximum memory in gigabytes that can be used by this
CDE service.
- Optional:
Under Additional Configurations, in NFS Storage
Class, specify the name of the custom NFS storage class. By default, CDE
uses the platform's in-built storage class discovered using the provisioner. The first
storage class will be used if multiple storage classes are configured using the same
provisioner.
-
Default Virtual Cluster selection is enabled by default to
create a default virtual cluster after enabling a CDE service. This helps you to create
your jobs easily, without having to wait to create a CDE virtual cluster as mentioned in
Creating virtual clusters, making the onboarding smoother. You can turn this toggle off if
you do not wish to use a default virtual cluster.
- Click Enable.
The CDE Home page displays the status of
the CDE service initialization. You can view logs for the service by
clicking on the service vertical ellipsis (three dots) menu, and then
clicking View Logs.


 at the top to enable CDE service for an
environment.