Cluster Monitoring with Grafana
Cloudera Data Science Workbench leverages Prometheus and Grafana to provide a dashboard that
allows you to monitor how CPU, memory, storage, and other resources are being consumed by your CDSW deployment. Prometheus is an internal data source that is auto-populated with resource consumption
data for each deployment. Grafana is the monitoring dashboard that allows you to create visualizations for resource consumption data from Prometheus.
By default, CDSW provides you with three Grafana dashboards: K8 Cluster, K8s Containers, and K8s Node. You can extend these dashboards or create more panels for other metrics. For more information, see the Grafana documentation.
To access the Grafana dashboard for your deployment:
- Log into Cloudera Data Science Workbench with site administrator privileges.
- Click
- Click the Grafana dashboard link. This will take you to the built-in Grafana server.
- To see all the available dashboards, click (or K8s
Containers or K8s Node).
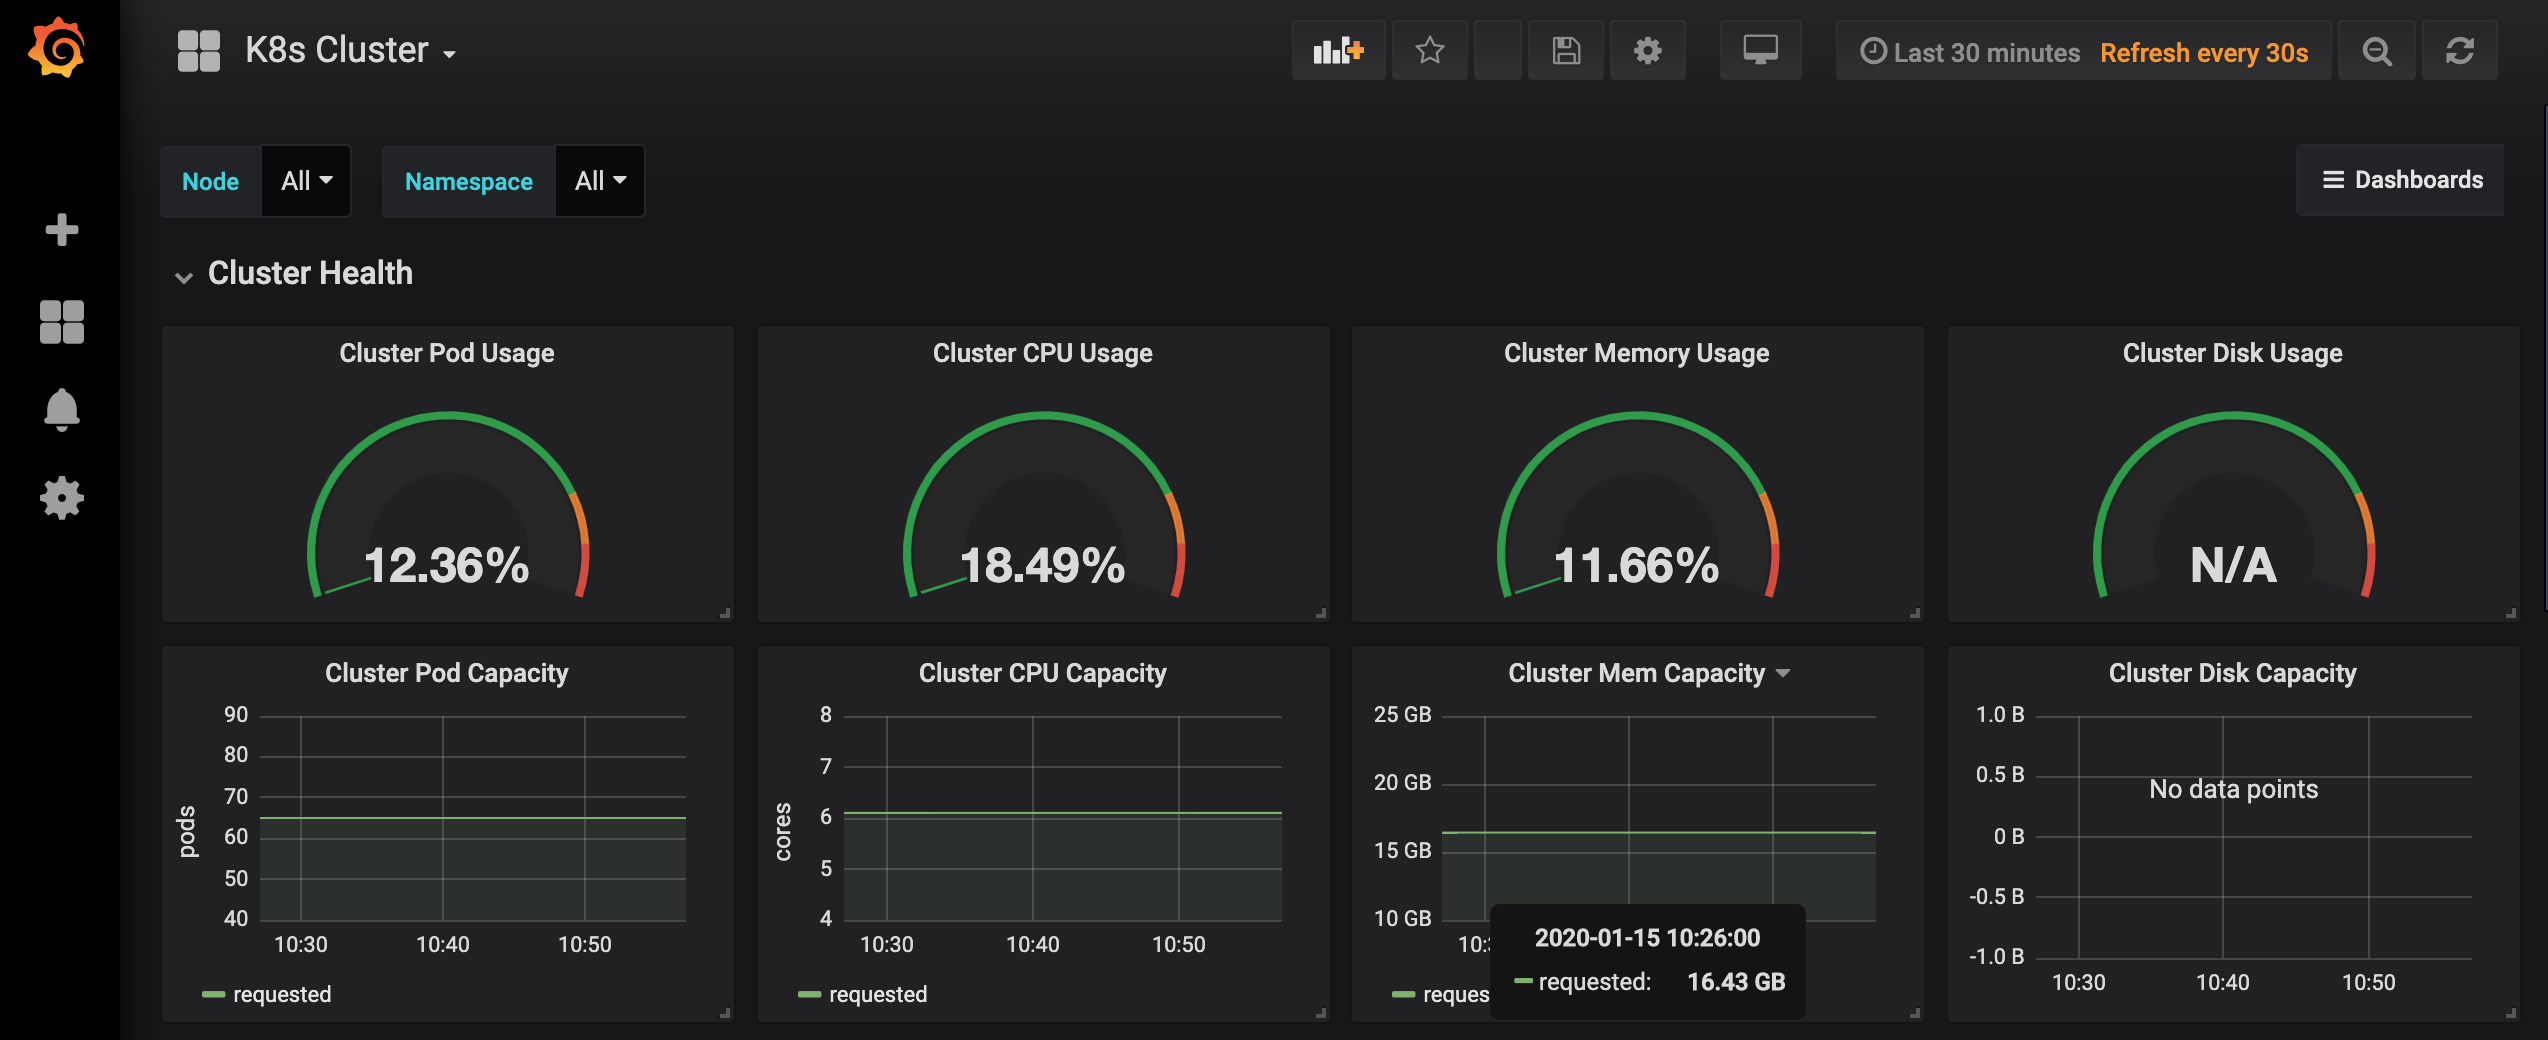
- K8s Cluster
- Provides metrics for the following:
- Overview of nodes, pods, and containers
- CPU capacity usage
- Memory capacity usage
- Pod capacity usage
- Disk capacity usage
- K8s Containers
- Provides metrics for the following:
- Memory usage per pod
- CPU Usage per pod
- Read/Write IOPS per pod
- K8s Node
- Provides metrics for the following:
- CPU usage per node
- Memory Usage per node
- Read/Write IOPS per node
- Available memory per node
- Network traffic per node
