Cloudera Enterprise Storage Device Acceptance Criteria Guide
Abstract
An organization’s requirements for a big-data solution are simple: acquire and combine any amount or type of data in its original fidelity, in one place, for as long as necessary, and deliver insights to all kinds of users, as quickly as possible.
Cloudera, an enterprise data management company, introduced the concept of the enterprise data hub (EDH): a central system to store and work with all data. The EDH has the flexibility to run a variety of enterprise workloads (for example, batch processing, interactive SQL, enterprise search, and advanced analytics) while meeting enterprise requirements such as integrations to existing systems, robust security, governance, data protection, and management. The EDH is the emerging center of enterprise data management. EDH builds on Cloudera Enterprise, which consists of the open source Cloudera Distribution including Apache Hadoop (CDH), a suite of management software and enterprise-class support.
Evolving storage solutions and virtualization frameworks have enabled new deployment models that were previously not possible. High-throughput Storage Area Network (SAN) and other shared storage solutions can present remote block devices to virtual machines in a flexible and performant manner that is often indistinguishable from a local disk. An Apache Hadoop workload provides a uniquely challenging IO profile to these storage solutions, and this can have a negative impact on the utility and stability of the Cloudera Enterprise cluster, and to other work that is utilizing the same storage backend.
This guide is intended to provide guidelines for evaluating and testing storage solutions to determine whether they can be used with Cloudera Enterprise. This guide only covers the evaluation of the storage solution, and does not cover general deployment guidance. For architecture and deployment guidance, please refer to the Cloudera Reference Architecture documents and the latest Cloudera Enterprise documentation.
Background
Hadoop has historically been designed to enable big data processing across a large cluster of commodity hardware leveraging hard drives attached at each cluster node. By leveraging the bulk aggregate throughput of a number of drives at every machine, each node in the cluster is able to read and write data to/from storage at a very high rate per node, and with processing moved as close as possible to the persisted data, movement of data across the cluster can be minimized. This is still the most high-performance architecture for Hadoop, but many IT organizations are standardizing on converged architectures that make it difficult or impossible to acquire cluster nodes with dedicated locally attached disks.
As networking technology advances and storage networks are able to provide higher levels of throughput, it can become possible to run big data workloads on a cluster leveraging remote block storage devices. This should still be seen as a tradeoff between the performance of a "bare metal" Hadoop cluster, and the ease of deployment offered by the remote storage offering. The agility and rapid deployment that is possible with virtualized environments and remote block storage can allow you to realize business value from your big data workload, even if the performance efficiency of the system doesn't approach that of physical nodes with direct attached disks.
Scope
This document covers any storage infrastructure that is able to present storage to the Cloudera Enterprise compute nodes as block devices that can be mounted in a way that is indistinguishable from a physical hard drive or disk that is local to the VM or hypervisor. If the virtualization framework or local machine includes specialized drivers or kernel modules, these must not interfere with the ability of the local operating system to utilize the block device in the same manner as it would use a directly attached disk. The device should be exposed locally as a supported filesystem (ext3, ext4 or XFS). This document does not support remote mounting of devices via NFS or SMB/Samba/cifs.
The block devices will be treated as hard disks and used as storage for all cluster services, including but not limited to HDFS, YARN, HBase, Spark and Hive.
Solution Architecture
Many virtualization frameworks and storage solution providers have developed architectures that allow the flexible connection of remote storage to virtual machines or physical servers. In order to provide maximum compatibility, the remote storage volume is typically presented to either the hypervisor or the local server as a block device using some method of device emulation.
The device that is presented to the local machine can be referred to as a virtual or logical block device. In some solutions, there can be be a 1:1 mapping between the logical block device and an actual remote block device. However, many vendors take advantage of aggregated storage, and multiple tiers of caching in order to try and provide flexibility and performance.
It is important to remember that although these architecture are built with the goal of presenting logical disks to the local server in a way that is extremely compatible with the assumption that they are directly attached, the reality of remote storage can include many interconnected parts that sometimes fail to maintain this illusion precisely.
IO operations that are targeted to a logical disk typically have to traverse a network of some sort. In some solutions, this is a dedicated, high bandwidth connection. In others the connection may be shared with client network workload or other storage workloads. Careful consideration should be given as to whether the simultaneous aggregate bandwidth available to service the storage devices for a Cloudera Enterprise cluster are sufficient for the intended workload.
While the shared backend problem is well understood, there can also be unexpected effects that are caused by the end-to-end combination of caching, queueing, and link characteristics at and between the local OS, VM/Physical server, hypervisor/storage controller, backend service endpoint, and physical storage media. True end to end performance is difficult to predict, and can exhibit unexpected low points, depending on the mixture of concurrent IO operations that the whole system is servicing at a given time.
Storage Performance Requirements
Block Storage Devices attached to Cluster Worker Nodes should be able to meet the following performance numbers:
Worker Nodes
| Minimum | Recommended | |
| Sustained Throughput Per Disk | 30MiB/s per disk, 100 async IOPs (32k block size) | 60MiB/s per disk, 200 async IOPs (32k block size) |
| Sustained Throughput Per Node | 200MiB/s per node, 1,200 IOPs (32k block size) | 800MiB/s per node, 3,200 async IOPs (32k block size) |
| Median latency (50%) | < 50 ms | < 10 ms |
| Maximum Measured Latency (99%) | < 200 ms | < 50 ms |
Master Nodes
| Minimum | Recommended | |
| Sustained Throughput Per Disk | 30MiB/s per disk, 500 async IOPs (4k block size), 100 sync IOPs (4k block size) | 60MiB/s per disk, 1,000 async IOPs (4k block size), 100 sync IOPs (4k block size) |
| Sustained Throughput Per Node | 120MiB/s per node, 1,500 IOPs (4k block size) | 240MiB/s per node, 3,200 async IOPs (4k block size) |
| Median latency (50%) | < 10 ms | < 5 ms |
| Maximum Measured Latency (99%) | < 100 ms | < 50 ms |
The above numbers should be sustainable while incurring continued read or write across all disks attached to each node, and across all nodes in the cluster. The testing scripts default to running each test for 1 hour (3,600 seconds). If your environment is subject to periodic fluctuations in load, you may with to increase the testing duration by increasing the value of testtime in the test-config file. The throughput should be managed and guaranteed via QoS or other governing method to ensure that adjacent workload does not impact the available performance for each node.
Cluster Storage Validation Overview
Before a cluster can be placed into production, the storage must be evaluated to confirm it meets the standards defined in this document. You should complete the following steps:
- Installation
- Physical/Virtual Hardware Provisioned
- Storage provisioned with relevant QoS and attached to nodes
- Install & Configure Cloudera Manager and CDH, with all roles assigned as planned for production
- Set up monitoring in Cloudera Manager
- Set up Storage Monitor dashboard
- Set up Latency Monitor alerts
- Microbenchmark Tests - Run Storage Profile Tools (See Microbenchmark Tests for instructions
on how to run the tests)
- Confirm that throughput and latency metrics are within tolerance for each node type
- Workload Tests - Run YCSB Workloads
- Confirm that maximum latency measured in storage is not above 99% number above
- Gather measurement data and submit to Cloudera.
Cluster Storage Validation Details
Installation
This guide assumes that hardware or virtual machines have been provisioned and that storage has been attached to the cluster nodes. If the storage devices are being provisioned by a team that is not directly involved in the project, be sure to provide them with information regarding the unique characteristics of Hadoop workloads as noted in the Solution Architecture section above. Ideally, the Hadoop cluster should be the only workload being served by a dedicated back-end infrastructure.
If Cloudera or the hardware vendor provide Reference Architecture documents, then these should be used as a guide. If there is not a vendor-specific Reference Architecture, then the Cloudera Enterprise Reference Architecture for Bare Metal Deployments can be used as a framework.
Cloudera Manager and any Cloudera Enterprise components should be installed in accordance with the Cloudera Documentation.
Cloudera Manager Monitoring
In addition to direct monitoring of test results, it is strongly recommended that clusters utilizing non-direct attached storage implement monitoring and alerting on specific metrics related to disk performance so that any problems can be identified quickly before they cause problems for Cloudera Enterprise workloads. This monitoring and alerting should be configured prior to any testing. This allows you to validate that the monitoring is functional and confirm the results of test workloads.
Storage Monitor Dashboard
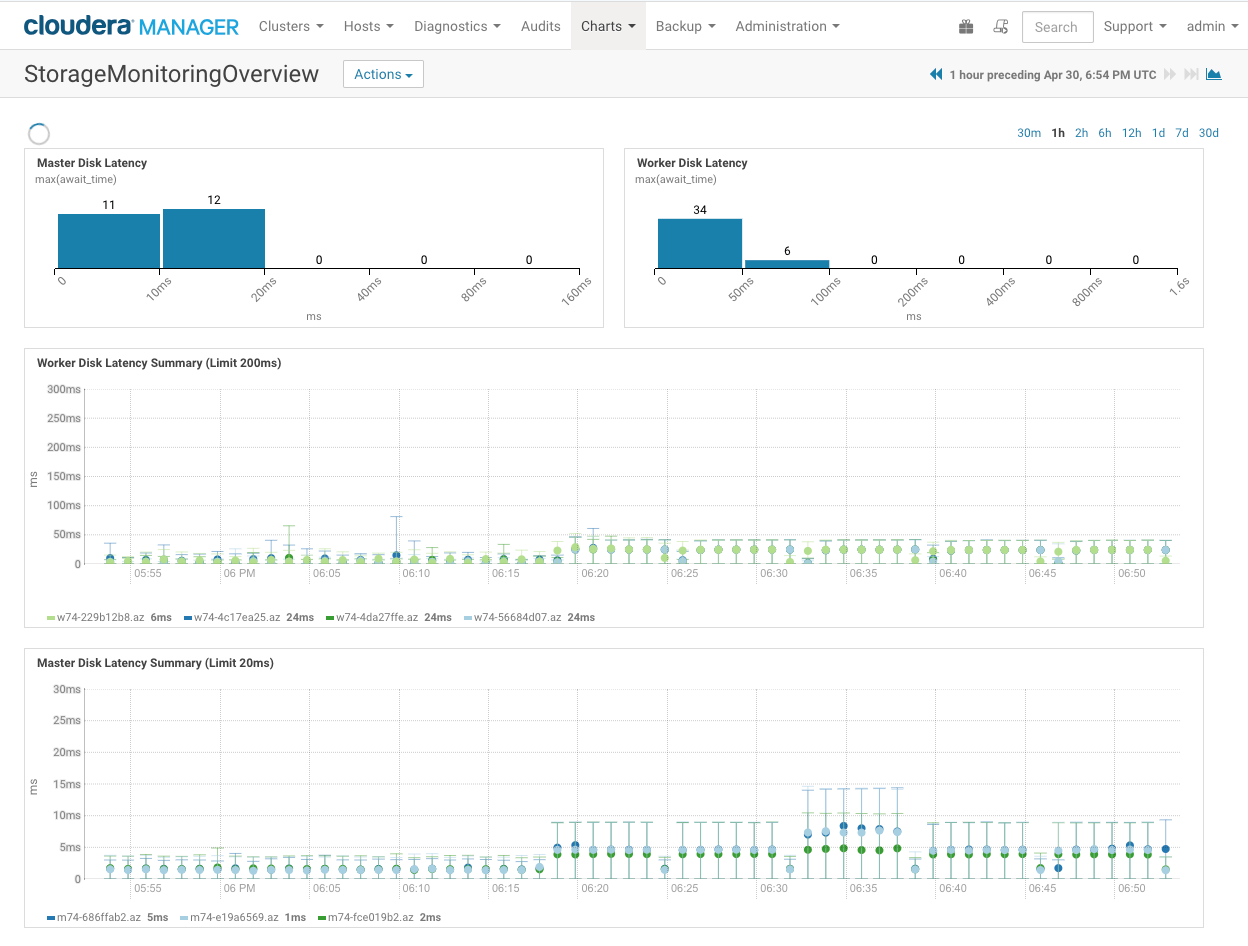
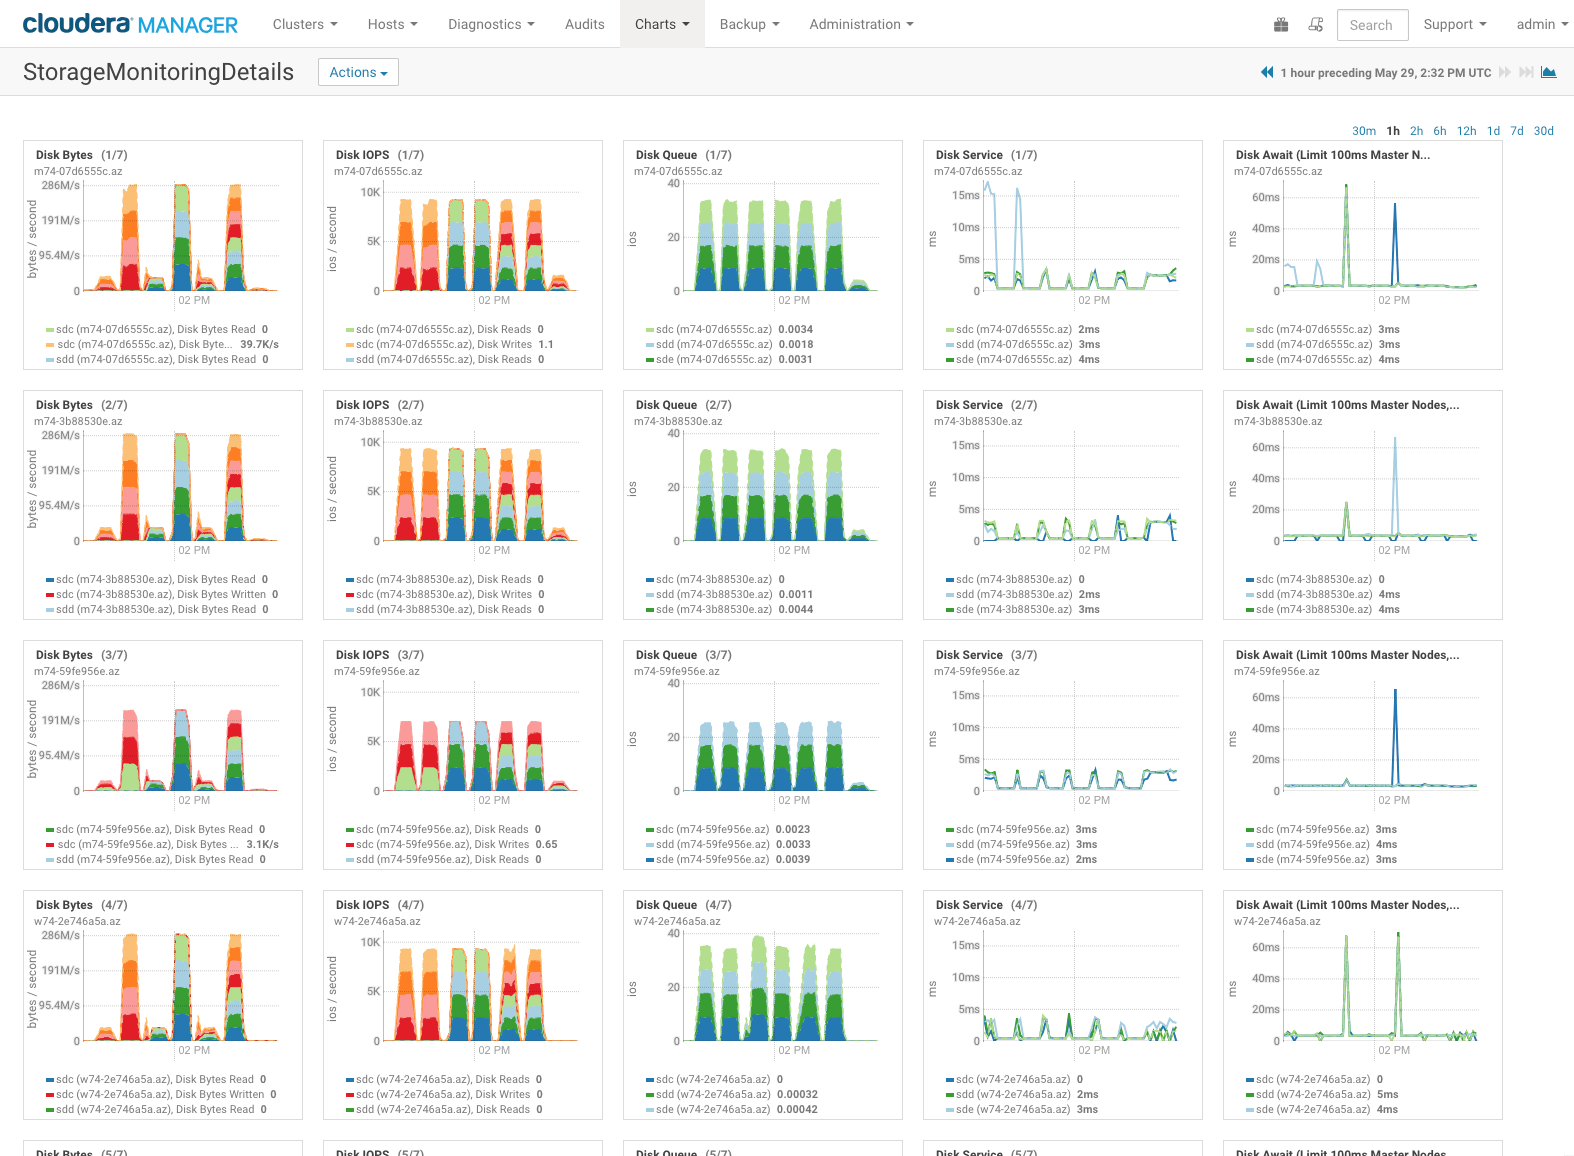
You should implement Cloudera Manager Dashboards that provide a succinct overview of important metrics for storage across the cluster. Dashboards can be imported using the Cloudera Manager Import Dashboard function. Example templates can be found at https://github.com/cloudera/partner-engineering/tree/master/storage-validation-toolkit (StorageMonitorOverview.json and StorageMonitorDetails.json).

The StorageMonitorOverview.json dashboard will highlight application-level IO latency measured across the nodes in the cluster.

The StorageMonitorDetails.json dashboard will break out individual disk and hosts so that you can pinpoint under performing elements in the cluster.

Storage Latency Alerts
Because storage latency for non-local storage can be impacted by outside factors, you should implement additional alerts in Cloudera Manager in order to highlight when the storage is not performing as expected.
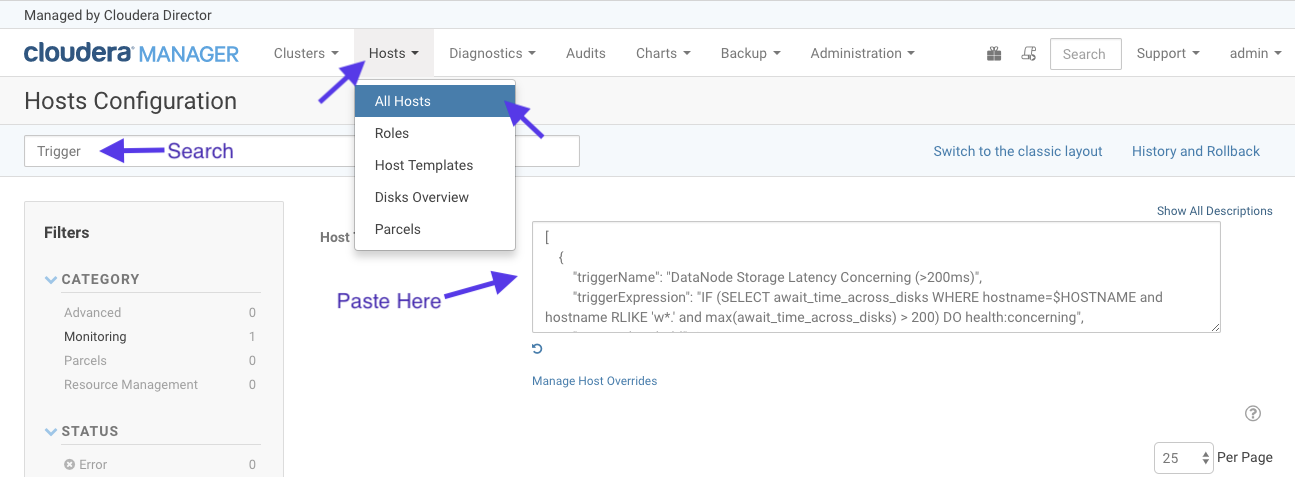
Detailed alerts (triggers) can be defined in Cloudera Manager as outlined in the documentation. An example trigger to highlight high measured latency can be found at https://github.com/cloudera/partner-engineering/tree/master/storage-validation-toolkit (StorageLatencyTriggers.json).
To import these example triggers, you must copy/paste the contents from the json file into the Cloudera Manager host settings as seen in the following screenshot:

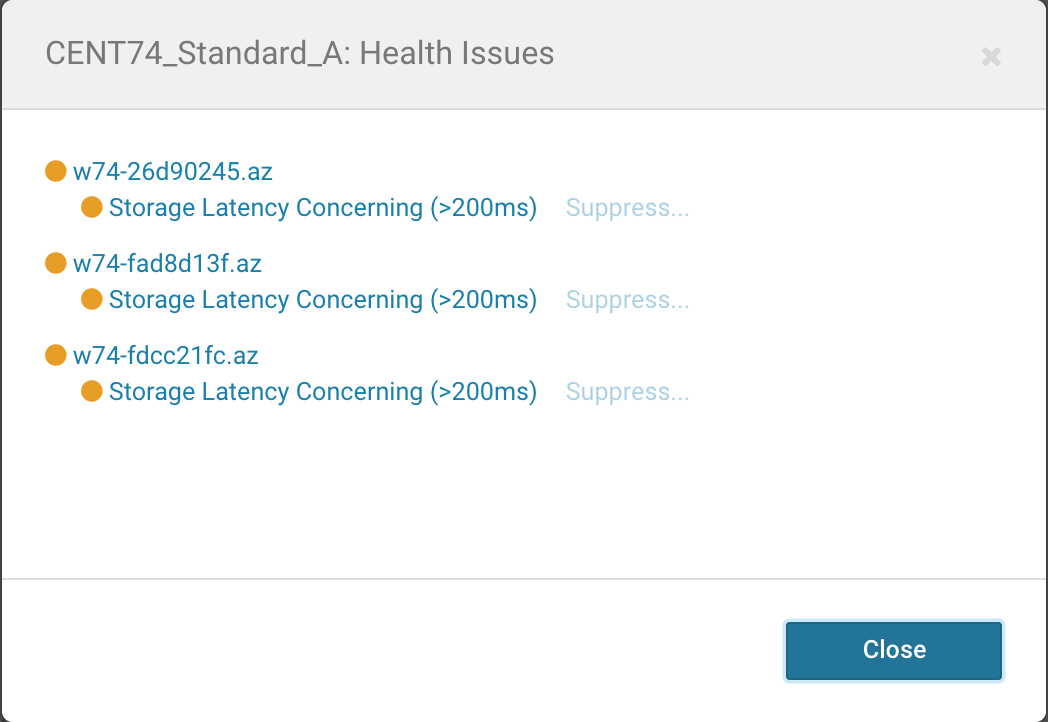
Once the trigger setting is saved, you will see alerts like the following if any recent storage latency metrics are above the expected maximum latency.

Microbenchmark Tests
This section will outline the requirements and process for running the microbenchmark tests across the cluster and gathering results
Prerequisites
You must have a utility node with network access to the cluster nodes. You should have a user named "cloudera" (or other test user as defined by the testuser variable in cluster-config) set up on the utility host that can ssh to all cluster nodes without requiring a password using an ssh public/private key pair. Additionally, for the duration of the test, the test user should be allowed passwordless sudo access on all of the systems under test. This user can be removed or disabled after the testing is completed, but may have to be added again in the future in order to revalidate the cluster storage.
Downloading the Test Scripts
You can use git to clone the repository that includes the tools by running:
git clone https://github.com/cloudera/partner-engineering.git
Alternately you may download a zip archive of the latest code from:
https://github.com/cloudera/partner-engineering/archive/master.zip
Preparing your configuration
You must edit the cluster-config file to represent the hosts in your cluster. The below snippet from the test-config file shows the format of this file.
hostgroups=( "master1" "master2" "worker" "edge" )
testdir="fio"
testuser="cloudera"

# There must be hosts_{group} and dirs_{group} variables defined for
# each entry in hostgroups above.
# There must be a type_{group} variable defined as either "master" or # "worker" to determine appropriate tests.

hosts_master1=( "10.3.0.15" )
dirs_master1=( "/data0" "/data1" "/data2" )
type_master1="master"

hosts_master2=( "10.3.0.16" "10.3.0.18" )
dirs_master2=( "/data0" "/data1" "/data2" "/data3" )
type_master2="master"

hosts_worker=( "10.3.0.13" "10.3.0.14" "10.3.0.17" "10.3.0.19" )
dirs_worker=( "/data0" "/data1" "/data2" "/data3" "/data4" "/data5" "/data6" "/data7" "/data8" "/data9" )
type_worker="worker"

hosts_edge=( "10.3.0.12" )
dirs_edge=( "/data0" )
type_edge="master"
Pay special attention to the quotations and punctuation. This snippet will set up bash array variables that are used by the other scripts in the toolkit. The elements in each array must be space-separated and you must maintain the spacing after each opening parenthesis, and before each closing parenthesis.
The hostgroups array should contain one entry for each uniquely configured node type in the cluster. Master nodes will often have different numbers of storage devices attached depending on the assigned services. As long as the mount points for drives are consistent, then only the number of attached drives need be considered for determining if one node is unique compared to another.
For each entry in the hostgroup array, you must define two more arrays. The hosts_{hostgroupentry} array will contain either the IP address of each host in the group, or a resolvable hostname for each host in the group. The dirs_{hostgroupentry} array should contain one entry pointing to each mounted disk for all nodes in the group. The type_{hostgroupentry} array should contain a value indicating whether the hostgroup nodes should be tested as "master" nodes or "worker" nodes.
During test setup, a subdirectory named 'fio' will be created under each referenced disk mount point (the name of this directory can be altered by changing the testfolder variable). This folder will be changed to be owned by the utility user "cloudera" (or other test user as defined by the testuser variable in cluster-config) so that it can be read/written by test processes later.
Generating the test configs
After you have edited the test-config file, you will generate the workload test configs by running:
./generate-test-configs
This will load the arrays defined in test-config and generate *.ini and *.list files in the test-files directory for several combinations of nodegroup, IO size, and IO pattern. The script does delete existing files from the test-files directory, so if you want to preserve files from a previous run, they must be backed up.
Install prerequisites and start FIO daemon on all hosts
To prepare all hosts for running tests, run:
./pre-fio-dir-all
This script will attempt to install the latest version of the fio storage testing tool and iperf3 network testing tool from EPEL. It will first run a double yum install for epel-release (some base installs will point to an older EPEL version), and then yum install fio and iperf3.
The script also iterates through the expected data directories for each host and creates a folder for the test data files and changes the ownership of this directory to facilitate later use in testing.
Next you should start the fio daemon process running on all hosts by running:
./start-fio-server-allRunning the workload tests
To run the IO tests across all hosts, run:
./run-all-fio-tests
This step will take some time. Fio is able to limit the runtime of some tests, but other tests will run until they complete a certain data size. All raw data results will be saved to the ./results directory in json format.
Clean up fio test data from cluster
To clean the fio data files and directories from the cluster nodes, run:
./clean-fio-dir-all
This script will remove all fio-generated data files, and also remove the directories that were created by pre-fio-dir-all. If you run this script and later want to re-run tests, you will have to run pre-fio-dir-all again.
Analyze the results
To analyze the collected log files, run:
./analyze-all-fio-logs
This will run through all of the log files that were generated during testing. Relevant bandwidth and latency data will be recorded in individual csv files, and a summary PASS/FAIL for each disk on each host will be recorded to individual txt files, and echoed to the screen. An example of this per-workload txt file is below:
Evaluating results/randrw_sync_4k_m.csv, Max=20 Med=10 IOPS=100, MBPS=0
PASS[],10.3.0.16, results/randrw_sync_4k_m.json, rand_rw.data0, randrw, /data0/fio, 2.99, 14.22, 18.37, 564, 141.20, 4.94, 16.05, 20.54, 564, 141.15
FAIL[ WRITE_LATENCY_MAX>100],10.3.0.16, results/randrw_sync_4k_master2.json, rand_rw.data1, randrw, /data1/fio, 2.99, 115.40, 170.71, 553, 138.32, 5.01, 29.26, 32.42, 563, 140.91
PASS[],10.3.0.16, results/randrw_sync_4k_m.json, rand_rw.data2, randrw, /data2/fio, 2.86, 15.01, 18.59, 568, 142.20, 4.94, 16.90, 18.21, 574, 143.59
PASS[],10.3.0.18, results/randrw_sync_4k_m.json, rand_rw.data0, randrw, /data0/fio, 2.89, 19.00, 20.24, 562, 140.62, 5.01, 19.00, 19.65, 562, 140.52
FAIL[ WRITE_LATENCY_MAX>100],10.3.0.16, results/randrw_sync_4k_m.json, rand_rw.data3, randrw, /data3/fio, 2.96, 102.05, 120.08, 563, 140.82, 4.94, 62.64, 72.37, 566, 141.66
PASS[],10.3.0.18, results/randrw_sync_4k_m.json, rand_rw.data1, randrw, /data1/fio, 3.03, 19.52, 20.13, 548, 137.10, 5.01, 14.87, 16.40, 558, 139.52
Any device that fails a test metric will include the details of the failure in the output line, as shown in red above.
The summary text files will be then be parsed and summarized into a timestamped text file with a name following the pattern: storage-test-YYYYMMDDhhmmss.summary. This file will include a readout of the cluster-config, test-config, and sections for all failed tests, all passed tests, and a summary at the bottom of the file like:
##########################################################################
# Summary
# Tests Passed: 205
# Tests Failed: 3
Any failed tests must be investigated and corrected, and the cluster re-tested prior to operationalizing the cluster.
Lastly, the script will create an archive named storage-test-YYYYMMDDhhmmss.tgz and include the .summary file, as well as all .json and .txt files from the test run.
Workload Tests
Follow the instructions at https://github.com/brianfrankcooper/YCSB to download and build the latest version of YCSB on a utility node. The toolkit requires the installation of Maven and dependencies to build, so you may want to add a utility node to the cluster with Cloudera Manager, and plan to decommission the utility host at a later time.
HBase
The utility node should be configured as a HBase gateway so that it has the necessary files and configurations present.
Per the YCSB guidance and HBASE-4163 you should create a pre-split table for testing purposes. The following script example is included as create-hbase-table-ycsb, but can be modified for tuning:
if [ -z "$1" ]; then
  echo "The first script argument must be the number of splits,
  #recommended to be 10 * number of regionservers"
  exit
fi

cat <<EOF | hbase shell -n
n_splits=$1 # HBase recommends (10 * number of regionservers)
create 'ycsbtable', 'family', {SPLITS => (1..n_splits).map {|i| "user#{1000+i*(9999-1000)/n_splits}"}}
EOF
After creating the table, you can script the running of all YCSB workloads on HBase with the run-all-hbase-workloads script. The script must be run from the YCSB directory only after the project has been properly built. The script takes a single argument, which must point to an HBASE configuration directory, such as /etc/hbase/conf.cloudera.CD-HBASE-* as found on a node configured as an HBase Gateway with Cloudera Manager.
if [ ! -d "$1" ]; then
  echo "The first script argument must be a directory containing HBase confguration files"; exit
fi

{
    for w in "workloada" "workloadb" "workloadc" "workloadd" "workloade" "workloadf"; do
      bin/ycsb load hbase20 -P workloads/$w -cp $1 -p table=ycsbtable -p columnfamily=family -p measurementtype=timeseries -p timeseries.granularity=20000 2>/dev/null;
      bin/ycsb run hbase20 -P workloads/$w -cp $1 -p table=ycsbtable -p columnfamily=family -p measurementtype=timeseries -p timeseries.granularity=20000 2>/dev/null;
    done
} | tee "hbase-ycsb-output.txt" | grep "Latency" | tee "hbase-ycsb-latency.txt"
maxlat=$( grep "MaxLatency(us)" "hbase-ycsb-latency.txt" | cut -d, -f3 | sort -nr | head -n1 )
if [ $maxlat -ge 200000 ]; then echo "FAIL[HBase_MaxLatency(${maxlat}us)>200000us]"; else echo "PASS[HBase_MaxLatency=${maxlat}us]"; fi | tee "hbase-ycsb.summary"
This will run each workload in sequence and output will be saved to hbase-ycsb-output.txt and a latency summary will be saved to hbase-ycsb-latency.txt. A single line beginning with PASS or FAIL will be generated indicating whether any workloads completed with Maximum request end-to-end latency greater than 200ms (or 200,000us as indicated in the output), and this PASS/FAIL output will be saved to hbase-ycsb.summary.
Kudu
You can script the running of all YCSB workloads on Kudu with the run-all-kudu-workloads script. The script must be run from the YCSB directory only after the project has been properly built. The first script argument must be a comma separated list of Kudu Master node hosts, like: "10.3.0.13,10.3.0.15,10.3.0.16". The second script argument must be the number of tablets, recommended 5 per tablet server.
if [ -z "$1" ]; then
  echo "The first script argument must be a comma separated list of Kudu Master hosts like: \"10.3.0.13,10.3.0.15,10.3.0.16\""; exit
fi

if [ -z "$2" ]; then
  echo "The second script argument must be the number of tablets, recommended 5 per tablet server."; exit
fi

{
    for w in "workloada" "workloadb" "workloadc" "workloadd" "workloade" "workloadf"; do
      bin/ycsb load kudu -P workloads/$w -cp $1 -p table=ycsbtable -p kudu_master_addresses=$1 -p kudu_pre_split_num_tablets=$2 2>/dev/null;
      bin/ycsb run kudu -P workloads/$w -cp $1 -p table=ycsbtable -p kudu_master_addresses=$1 -p measurementtype=timeseries -p timeseries.granularity=20000 2>/dev/null;
    done
} | tee "kudu-ycsb-output.txt" | grep "Latency" | tee "kudu-ycsb-latency.txt"
maxlat=$( grep "MaxLatency(us)" "kudu-ycsb-latency.txt" | cut -d, -f3 | sort -nr | head -n1 )
if [ $maxlat -ge 200000 ]; then echo "FAIL[Kudu_MaxLatency(${maxlat}us)>200000us]"; else echo "PASS[Kudu_MaxLatency=${maxlat}us]"; fi | tee "kudu-ycsb.summary"
This will run each workload in sequence and output will be saved to kudu-ycsb-output.txt and a latency summary will be saved to kudu-ycsb-latency.txt. A single line beginning with PASS or FAIL will be generated indicating whether any workloads completed with Maximum request end-to-end latency greater than 200ms (or 200,000us as indicated in the output), and this PASS/FAIL output will be saved to kudu-ycsb.summary.
Gather Results
The following files should be collected and submitted as email attachments to Cloudera at: rbs-cluster-validation@cloudera.com
- storage-test-YYYYMMDDhhmmss.tgz
- kudu-ycsb.summary and kudu-ycsb-output.txt (if running Kudu)
- hbase-ycsb.summary and hbase-ycsb-output.txt (if running HBase)
The subject of the email should include "RBS Cluster Validation for {UUID}", where {UUID} is replaced with the UUID from the Cloudera Enterprise license that is being used for the cluster. There will not be a reply or validation of the submitted logs, but they may be referenced by Cloudera Support for future cases related to the cluster.
Storage Performance and Cluster Revalidation
The cluster performance can be significantly impacted by changes to the storage environment. The cluster validation steps indicated in this guide should be re-run in any of the following scenarios:
- Nodes Added to Cluster
- Hardware or Software updates performed on Storage infrastructure
- Changes in adjacent workload profiles on Storage infrastructure
- If there are performance concerns or errors that point to storage timeouts or delays
In order to perform revalidation, the cluster must be otherwise idle, which will incur necessary downtime for the cluster. This requirement should be factored into SLA that is communicated to the stakeholders.
Support Considerations
When opening a support ticket with Cloudera Support, please include the following information at the beginning of the case description:
- The fact that the cluster is using remote block storage devices, and specifics for the storage solution vendor and configuration.
- The date of the last run of the Storage Validation process
If Cloudera Support has a concern that the cause of the support issue is related to remote storage performance, we may require that the cluster be taken offline and that the Storage Validation process be re-run. This can assist with ruling out the storage back-end as a cause of the issue, or may pinpoint specific nodes or block devices that are under performing.