

1.2.1. Accessing Grafana
You can access the Grafana UI as part of the Ambari Metrics System.
In Ambari Web, browse to Services > Ambari Metrics > Summary.
Select Quick Links and then choose Grafana.
A new tab will open in your browser with the Grafana UI.
![[Note]](../common/images/admon/note.png) | Note |
|---|---|
You have read-only access to Grafana. You will not be able to modify the pre-built dashboards or add new dashboards. |
|
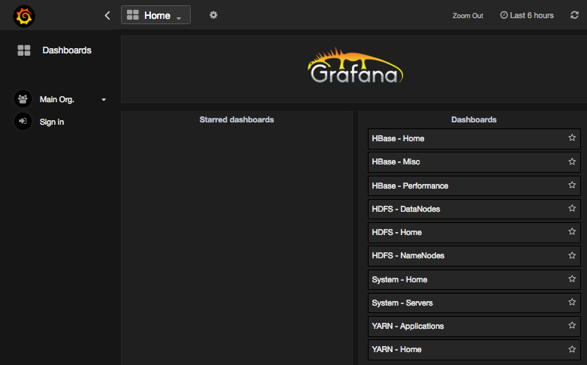
Dashboard |
Description |
|---|---|
| HDFS |
Provides information about HDFS performance and file activity. See HDFS Dashboards for more information. |
|
YARN |
Provides information about YARN application and queue activity. See YARN Dashboards for more information. |
|
HBase |
Provides information about HBase performance and file activity. See HBase Dashboards for more information. |
|
System |
Provides information about overall system performance and file activity. See System Dashboards for more information. |
| NiFi | Provides information about NiFi JVM, thread, FlowFile, and byte activity. See NiFi Dashboard for more information. |