Troubleshooting Hive
This section provides guidance on problems you may encounter while installing, upgrading, or running Hive.
With Hive, the most common troubleshooting aspects involve performance issues and managing disk space. Because Hive uses an underlying compute mechanism such as MapReduce or Spark, sometimes troubleshooting requires diagnosing and changing configuration in those lower layers.
HiveServer2 Performance Tuning and Troubleshooting
- Many Hive table partitions.
- Many concurrent connections to HS2.
- Complex Hive queries that access significant numbers of table partitions.
Symptoms Displayed When HiveServer2 Heap Memory is Full
When HS2 heap memory is full, you might experience the following issues:
- HS2 service goes down and new sessions fail to start.
- HS2 service seems to be running fine, but client connections are refused.
- Query submission fails repeatedly.
- HS2 performance degrades and displays the following behavior:
- Query submission delays
- Long query execution times
Troubleshooting
HiveServer2 Service Crashes
If the HS2 service crashes frequently, confirm that the problem relates to HS2 heap exhaustion by inspecting the HS2 instance stdout log.
- In Cloudera Manager, from the home page, go to .
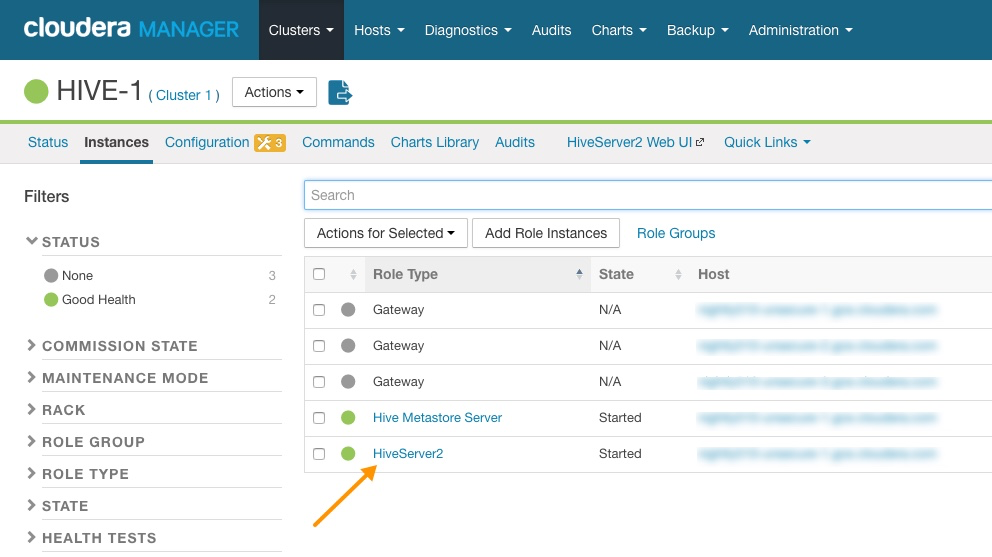
- In the Instances page, click the link of the HS2 node that is down:
HiveServer2 Link on the Cloudera Manager Instances Page

- On the HiveServer2 page, click Processes.
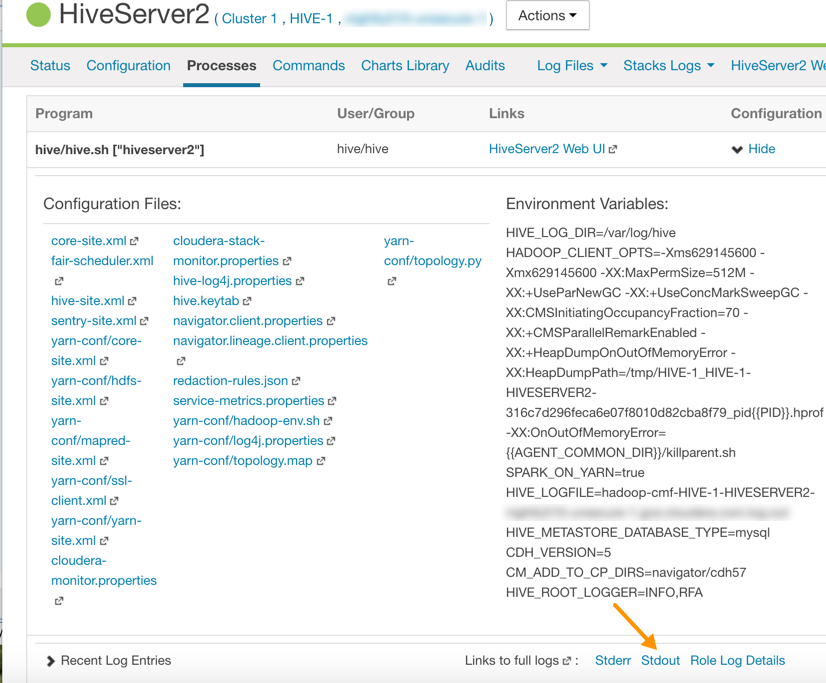
- On the HiveServer2 Processes page, scroll down to the Recent Log Entries and click the link to the Stdout log.
Link to the Stdout Log on the Cloudera Manager Processes Page

- In the stdout.log, look for the following error:
# java.lang.OutOfMemoryError: Java heap space
# -XX:OnOutOfMemoryError="/usr/lib64/cmf/service/common/killparent.sh"
# Executing /bin/sh -c "/usr/lib64/cmf/service/common/killparent.sh"
Video: Troubleshooting HiveServer2 Service Crashes
For more information about configuring Java heap size for HiveServer2, see the following video:
After you start the video, click YouTube in the lower right corner of the player window to watch it on YouTube where you can resize it for clearer viewing.
HiveServer2 General Performance Problems or Connections Refused
For general HS2 performance problems or if the service refuses connections, but does not completely hang, inspect the Cloudera Manager process charts:
- In Cloudera Manager, navigate to .
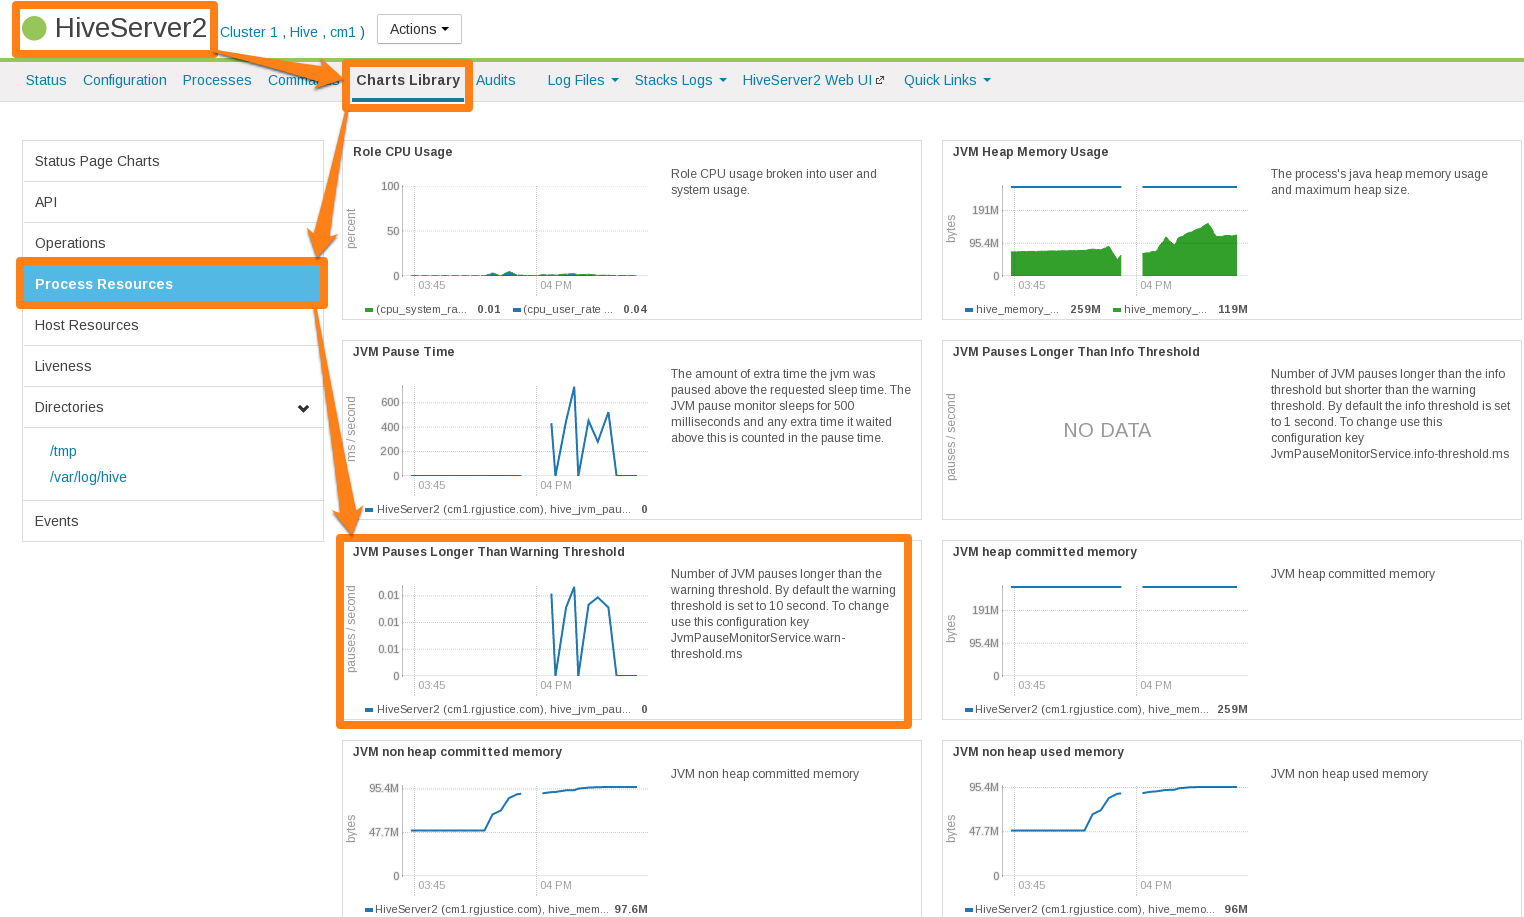
- In the Process Resources section of the Charts Library page, view the JVM Pause Time and the JVM Pauses Longer Than Warning Threshold charts for signs that JVM has paused to manage resources. For example:
Cloudera Manager Chart Library Page for Process Resources

HiveServer2 Performance Best Practices
High heap usage by the HS2 process can be caused by Hive queries accessing high numbers of table partitions (greater than several thousand), high levels of concurrency, or other Hive workload characteristics described in Identify Workload Characteristics That Increase Memory Pressure.
HiveServer2 Heap Size Configuration Best Practices
Optimal HS2 heap size configuration depends on several factors, including workload characteristics, number of concurrent clients, and the partitioning of underlying Hive tables. To resolve HS2 memory-related issues, confirm that the HS2 heap size is set properly for your environment.
- In CDH 5.7 and higher, Cloudera Manager starts the HS2 service with 4 GB heap size by default unless hosts have insufficient memory. However, the heap size on lower versions of CDH or
upgraded clusters might not be set to this recommended value. To raise the heap size to at least 4 GB:
- In Cloudera Manager, go to .
- Set Java Heap Size of HiveServer2 in Bytes to 4 GiB and click Save Changes.
- From the Actions drop-down menu, select Restart to restart the HS2 service.
If HS2 is already configured to run with 4 GB or greater heap size and there are still performance issues, workload characteristics may be causing memory pressure. Increase heap size to reduce memory pressure on HS2. Cloudera does not recommend exceeding 16 GB per instance because of long garbage collection pause times. See Identify Workload Characteristics That Increase Memory Pressure for tips to optimize query workloads to reduce the memory requirements on HS2. Cloudera recommends splitting HS2 into multiple instances and load-balancing once you start allocating over 16 GB to HS2.
- If workload analysis does not reveal any major issues, or you can only address workload issues over time, consider the following options:
- Increase the heap size on HS2 in incremental steps. Cloudera recommends increasing the heap size by 50% from the current value with each step. If you have increased the heap size to 16 GB and issues persist, contact Cloudera Support.
- Reduce the number of services running on the HS2 host.
- Load-balance workloads across multiple HS2 instances as described in How the Number of Concurrent Connections Affect HiveServer2 Performance.
- Add more physical memory to the host or upgrade to a larger server.
How the Number of Concurrent Connections Affect HiveServer2 Performance
The number of concurrent connections can impact HS2 in the following ways:
-
High number of concurrent queries
High numbers of concurrent queries increases the connection count. Each query connection consumes resources for the query plan, number of table partitions accessed, and partial result sets. Limiting the number of concurrent users can help reduce overall HS2 resource consumption, especially limiting scenarios where one or more "in-flight" queries returns large result sets.
How to resolve:
- Load-balance workloads across multiple HS2 instances by using HS2 load balancing, which is available in CDH 5.7 and later. Cloudera recommends that you determine the total number of HS2 servers on a cluster by dividing the expected maximum number of concurrent users on a cluster by 40. For example, if 400 concurrent users are expected, 10 HS2 instances should be available to support them. See Configuring HiveServer2 High Availability in CDH for setup instructions.
- Review usage patterns, such as batch jobs timing or Oozie workflows, to identify spikes in the number of connections that can be spread over time.
-
Many abandoned Hue sessions
Users opening numerous browser tabs in Hue causes multiple sessions and connections. In turn, all of these open connections lead to multiple operations and multiple result sets held in memory for queries that finish processing. Eventually, this situation leads to a resource crisis.
How to resolve:
- Reduce the session timeout duration for HS2, which minimizes the impact of abandoned Hue sessions. To reduce session timeout duration, modify these configuration parameters as follows:
- hive.server2.idle.operation.timeout=7200000
The default setting for this parameter is 21600000 or 6 hours.
- hive.server2.idle.session.timeout=21600000
The default setting for this parameter is 43200000 or 12 hours.
To set these parameters in Cloudera Manager, go to , and then search for each parameter.
- hive.server2.idle.operation.timeout=7200000
- Reduce the size of the result set returned by adding filters to queries. This minimizes memory pressure caused by "dangling" sessions.
- Reduce the session timeout duration for HS2, which minimizes the impact of abandoned Hue sessions. To reduce session timeout duration, modify these configuration parameters as follows:
Identify Workload Characteristics That Increase Memory Pressure
If increasing the heap size based on configuration guidelines does not improve performance, analyze your query workloads to identify characteristics that increase memory pressure on HS2. Workloads with the following characteristics increase memory requirements for HS2:
- Queries that access a large number of table partitions:
- Cloudera recommends that a single query access no more than 10,000 table partitions. If joins are also used in the query, calculate the combined partition count accessed across all tables.
- Look for queries that load all table partitions in memory to execute. This can substantially add to memory pressure. For example, a query that accesses a partitioned table with the
following SELECT statement loads all partitions of the target table to execute:
SELECT * FROM <table_name> LIMIT 10;
How to resolve:
- Add partition filters to queries to reduce the total number of partitions that are accessed. To view all of the partitions processed by a query, run the EXPLAIN DEPENDENCY clause, which is explained in the Apache Hive Language Manual.
- In the Metastore Server Advanced Configuration Snippet (Safety Valve) for hive-site.xml, set the hive.metastore.limit.partition.request parameter to 1000
to limit the maximum number of partitions accessed from a single table in a query. See the Apache wiki for information about setting this parameter. If this parameter is set, queries that access more than 1000 partitions fail with the following error:
MetaException: Number of partitions scanned (=%d) on table '%s' exceeds limit (=%d)
Setting this parameter protects against bad workloads and identifies queries that need to be optimized. To resolve the failed queries:- Apply the appropriate partition filters.
- Increase the cluster-wide limit beyond 1000, if needed. This action adds memory pressure to HiveServer2 and the Hive metastore.
- If the accessed table is not partitioned, see this Cloudera Engineering Blog post, which explains how to partition Hive tables to improve query performance. Choose columns or dimensions for partitioning based upon usage patterns. Partitioning tables too much causes data fragmentation, but partitioning too little causes queries to read too much data. Either extreme makes querying inefficient. Typically, a few thousand table partitions is fine.
- Wide tables or columns:
- Memory requirements are directly proportional to the number of columns and the size of the individual columns. Typically, a wide table contains over 1,000 columns. Wide tables or columns can cause memory pressure if the number of columns is large. This is especially true for Parquet files because all data for a row-group must be in memory before it can be written to disk. Avoid wide tables when possible.
-
Large individual columns also cause the memory requirements to increase. Typically, this happens when a column contains free-form text or complex types.
How to resolve:
- Reduce the total number of columns that are materialized. If only a subset of columns are required, avoid SELECT * because it materializes all columns.
- Instead, use a specific set of columns. This is particularly efficient for wide tables that are stored in column formats. Specify columns explicitly instead of using SELECT *, especially for production workloads.
- High query complexity
Complex queries usually have large numbers of joins, often over 10 joins per query. HS2 heap size requirements increase significantly as the number of joins in a query increases.
How to resolve:
- Make sure that partition filters are specified on all partitioned tables that are involved in JOINs.
- Whenever possible, break queries into multiple smaller queries with intermediate temporary tables.
- Improperly written user-defined functions (UDFs)
Improperly written UDFs can exert significant memory pressure on HS2.
How to resolve:
- Understand the memory implications of the UDF and test it before using it in production environments.
General Best Practices
The following general best practices help maintain a healthy Hive cluster:
- Review and test queries in a development or test cluster before running them in a production environment. Monitor heap memory usage while testing.
- Redirect and isolate any untested, unreviewed, ad-hoc, or "dangerous" queries to a separate HS2 instance that is not critical to batch operation.