Cloudera Navigator Data Management Overview
The section describes basic features of Cloudera Navigator data management.
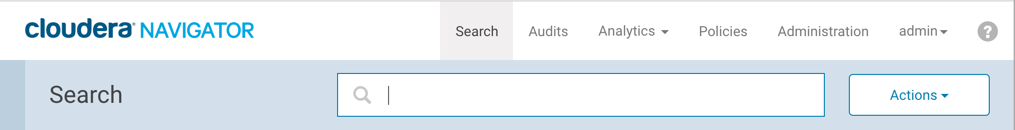
Cloudera Navigator Data Management UI
- The volume of data can be very large.
- Multiple people can access that data. How do you know who is accessing what data, and how it is being used?
- Tracking data can be challenging. Where did the data originate? Has it been altered? In how many places is that data being used? In regulated industries, answers to these questions must be precise and provable. For example, how can you make sure that you are complying with industry or government requirements for the deletion or preservation of data?
- Create and view audit reports
- Search entity metadata, view entity lineage, and modify custom metadata
- Define policies for modifying custom metadata and sending notifications when entities are extracted
- Get "at-a-glance" information about activity on the cluster for a defined period of time through the Data Stewardship dashboard.
- View metadata analytics
- Assign user roles to groups
Navigator auditing, metadata, lineage, policies, and analytics all support multi-cluster deployments managed by a single Cloudera Manager instance. So if you have five clusters, all centrally managed by a single Cloudera Manager, you see all this information in a single Navigator data management UI. In the metadata part of the UI, Navigator provides technical metadata that tracks the specific cluster from which the data is derived.
Starting and Logging into the Cloudera Navigator Data Management UI
- Do one of the following:
- Enter the URL of the Navigator UI in a browser: http://Navigator_Metadata_Server_host:port/, where Navigator_Metadata_Server_host is the name of the host on which you are running the Navigator Metadata Server role and port is the port configured for the role. The default port of the Navigator Metadata Server is 7187. To change the port, follow the instructions in Configuring the Navigator Metadata Server Port.
- Select .
- Navigate from the Navigator Metadata Server role:
- Select .
- Click the Instances tab.
- Click the Navigator Metadata Server role.
- Click the Cloudera Navigator link.
- Log in to Cloudera Navigator UI using the credentials assigned by your administrator.
Cloudera Navigator Data Management API
The Cloudera Navigator data management API provides access to the same features as the UI.
The API available at http://Navigator_Metadata_Server_host:port/api/v10, where Navigator_Metadata_Server_host is the name of the host on which you are running the Navigator Metadata Server role and port is the port configured for the role. The default port of the Navigator Metadata Server is 7187. To change the port, follow the instructions in Configuring the Navigator Metadata Server Port. The API supports HTTP Basic Authentication, accepting the same users and credentials as the UI.
To get a listing of the API calls invoked by the UI, see Downloading a Debug File.
Accessing API Documentation
For API documentation, select  or go to Navigator_Metadata_Server_host:port/api-console/index.html. The Cloudera Navigator API documentation displays in a new window. The API is structured into resource categories. Click a category to
display the resource endpoints.
or go to Navigator_Metadata_Server_host:port/api-console/index.html. The Cloudera Navigator API documentation displays in a new window. The API is structured into resource categories. Click a category to
display the resource endpoints.
To view an API tutorial, click the Tutorial link at the top of the API documentation or go to Navigator_Metadata_Server_host:port/api-console/tutorial.html
Capturing and Downloading API Calls
To capture API calls made from the Cloudera Navigator data management UI, enable debug mode. You can then download a file containing the captured calls and send it to Cloudera.
Enabling and Disabling Debug Mode
To enable debug mode:- Start and log in to the Cloudera Navigator data management component UI.
- In the top right, select . A red box with the following message displays at the bottom right of the UI.
Debug mode enabled. Captured 0 calls.
- Reload the page so that all API calls are captured.
- In the top right, select .
- Click Disable in the red box at the bottom right of the UI.
Downloading a Debug File
In debug mode, the n in the string "Captured n calls." is incremented with the number of calls of the Cloudera Navigator data management API as you interact with the Cloudera Navigator data management UI. To download a file containing information about the API calls, click Download debug file. A file named api-data-Navigator_Metadata_Server_host-UTC timestamp.json is downloaded. For example:{
"href": "http://Navigator Metadata Server hostname:port/?view=detailsView&id=7f44221738670c98baf0799aa6abd330&activeView=lineage&b=ImMka",
"userAgent": ...
"windowSize": ...
},
"timestamp": 1456795776671,
"calls": [
{
"type": "POST",
"url": "/api/v6/interactive/entities?limit=0&offset=0",
"data":...,
"page": "http://Navigator Metadata Server hostname:port/?view=resultsView&facets=%7B%22type%22%3A%5B%22database%22%5D%7D",
"timestamp": 1456795762472
},
{
"type": "GET",
"url": "/api/v3/entities?query=type%3Asource",
"status": 200,
"responseText": ...,
"page": "http://Navigator Metadata Server hostname:port/?view=resultsView&facets=%7B%22type%22%3A%5B%22database%22%5D%7D",
"timestamp": 1456795763233
},
...Displaying Cloudera Navigator Data Management Documentation
To display Cloudera Navigator data management documentation:
- Start and log in to the Cloudera Navigator data management component UI.
- Select . The Cloudera Navigator data management online documentation displays in a new window.