Using Audit Events to Understand Cluster Activity
The examples below step through these common use cases.
To work with Audit Events in the Cloudera Navigator console, you must have an account with the user role of Auditing Viewer or Navigator Administrator .
- Log in to the Cloudera Navigator console.
- Click the Audits tab. The default view displays a list of all Audit Events for the past hour (note the date range field above the listing, below the Actions button).
- Configure and apply filters as needed to find specific events by username, by source, for selected time frames, and so on.
What Did a Specific User Do on a Specific Day?
A data engineer complains that a job was not running as well as expected one afternoon and wants to find out what might have occurred.
- Limit the list of audit events to those for a specific user by defining a username filter:
- Click Filters to open the filter selector.
- Select Username from the Select Property... drop-down selector.
- Set the evaluation operator (=, like, !=) to = (equals sign).
- Type the username (cmjobuser for this example).
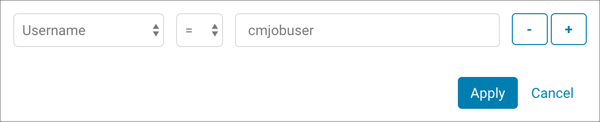
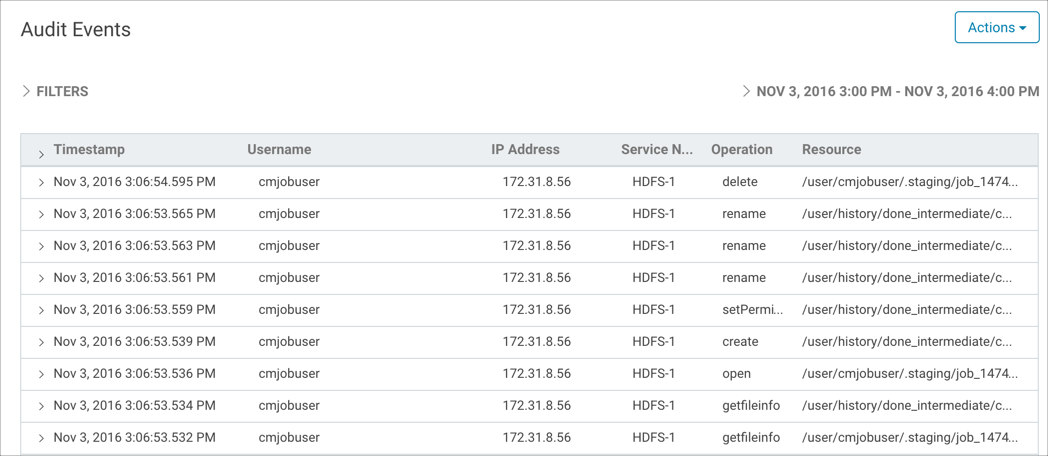
- Click Apply. The filter is applied to the audit events and the list displays only those events for the selected username.
- Limit the Audit Events list for the selected username to only those events that occurred on a specific date at a specific time:
- Click the arrow next to the current date range field to open the date and time range options selector. Time frame options range from the last 2, 6, 12, or 24 hours to the last 7 or
last 30 days, but also let you set a custom range.
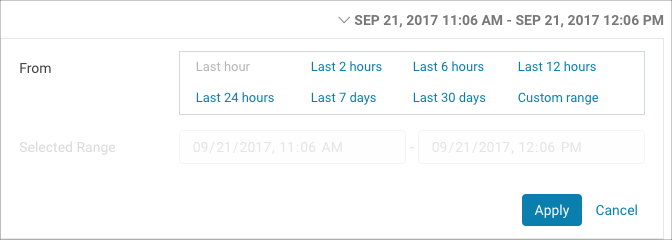
- Click the Custom Range link to open the date and time range selector.
- Use the field controls to set the start date and time and the end date and time for your custom time frame, as shown in this example:
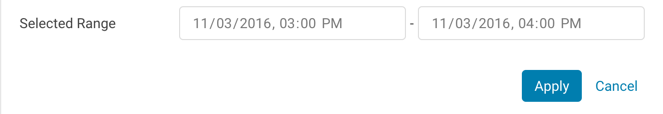
- Click Apply.
- Click the arrow next to the current date range field to open the date and time range options selector. Time frame options range from the last 2, 6, 12, or 24 hours to the last 7 or
last 30 days, but also let you set a custom range.
Who Deleted Files from Hive Warehouse Directory?
- /user/hive/warehouse
- Limit the list of Audit Events to only those for the /user/hive/warehouse directory:
- Click Filters.
- Select Source from the Select Property... drop-down selector.
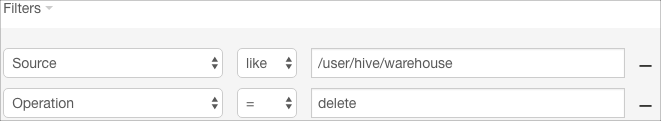
- Set the evaluation operator to like.
- Type /user/hive/warehouse in the entry field for the Source property.
- Click Apply. The source filter added to the list of filters and applied to Audit Events, returning an updated Audit Events list.
- Find all delete operations that occurred on the source (the Hive warehouse directory, in this example):
- Click Filters. The Source filter displays the filter previously configured. Click the plus sign (+) at the end of the filter definition to add new filter setting fields.
- Select Operation from the Select Property... drop-down selector.
- Set the evaluation operator to =.
- Type delete in the entry field for Operation property.
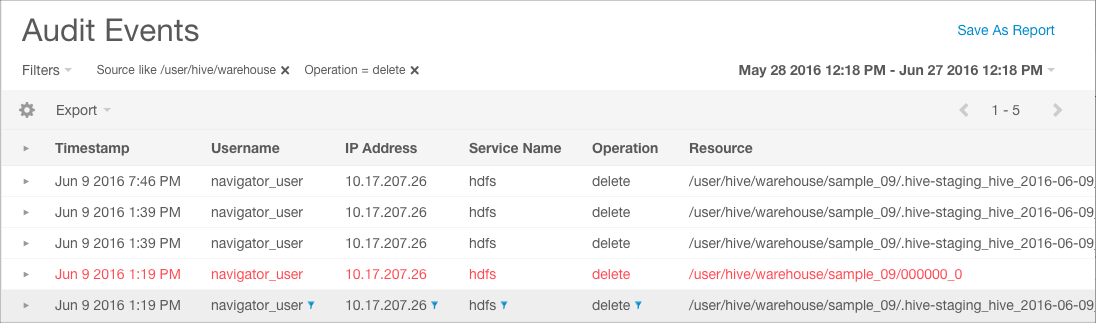
- Click Apply. The filter to select delete operations is added to the list of filters and applied to Audit Events. An updated Audit Events list is returned, showing only delete operations for sources similar to /user/hive/warehouse.
The results show both completed and attempted delete operations (attempted but unsuccessful are in red). All these events are associated with username navigator_user from the same IP address and using the same service (hdfs) over the course of a day (June 9, 2016).
- Log in to the Cloudera Navigator console.
- Click the Administration tab.
- Click the Role Management tab.
What Happened to Data in the Database?
The data files associated with a database are typically partitioned into files or directories by date, often by year. The system admin discovers that the data from 2015 is missing from the production database—only data prior to 2010 has been archived off the system, so data from 2015 should still be there.
Files for data created in 2015 include 2015 in their filenames.
- Filter the list of events for sources containing 2015:
- Click Filters.
- Select Source from the Select Property... drop-down selector. Sources can be paths to HDFS files or directories.
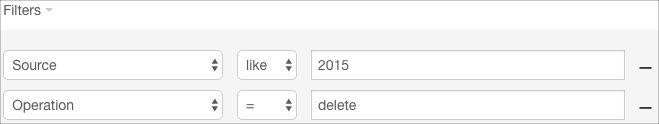
- Set the evaluation operator to like.
- Type 2015 in the entry field for the Source property.
- Click Apply. The source filter added to the list of filters and applied to Audit Events, returning an updated Audit Events list.
- Filter the list of events for the delete operation:
- Click Filters. The Source filter displays the filter previously configured. Click the plus sign (+) at the end of the filter definition to add new filter setting fields.
- Select Operation from the Select Property... drop-down selector.
- Set the evaluation operator to =.
- Type delete in the entry field for the Operation property.
- Click Apply. The operation filter added to the list of filters and applied to Audit Events, returning an updated list containing Audit Events for delete operations from sources like 2015.
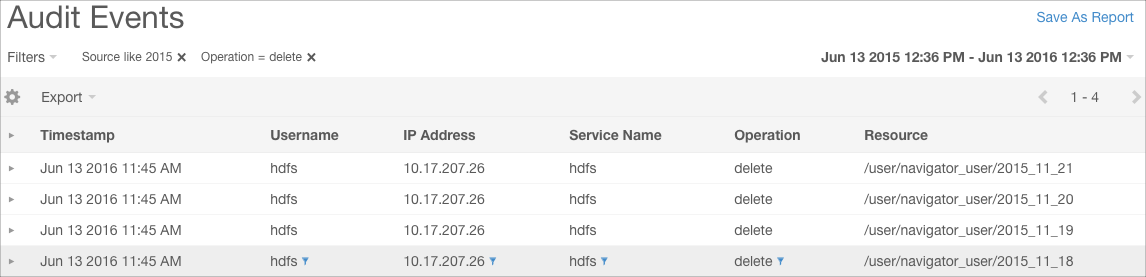
- Set the date range to one year:
- Click the date-time field at the top right of the Audit Events page.
- To set the range to be the last year, click Custom Range. The Selected Range field is enabled for input.
- In the left date field, use the field controls to specify a date one year ago.
- Click Apply.
The result of all filters and the selected time frame reveals that the hdfs username deleted directories containing 2015 in their names:
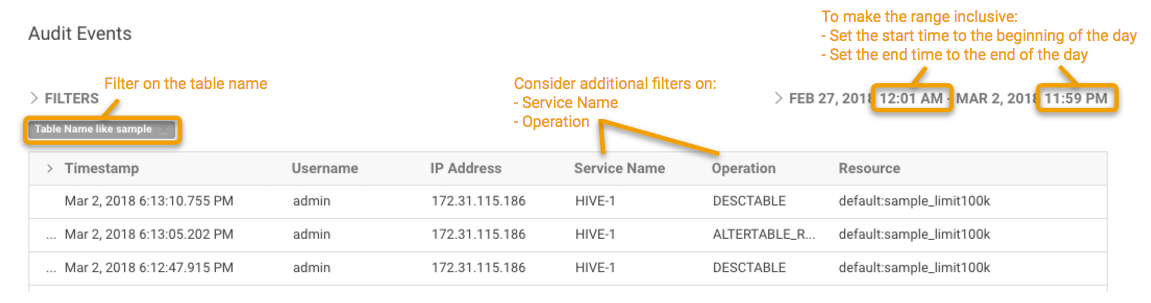
Who ran which operation against a table?
When a change occurs to a data asset, it can cause problems to reports or other processes that use the data asset. You can use the Audit events to find when and what caused a change in a data asset. This example describes how to use audits to determine what caused a schema change to a table so you can identify the user or process that may be causing unwanted changes.
To find all operations against a specific table in a general time range:
- Filter the list of events for the table.
- Click Filters.
- Select Table Name from the Select Property... drop-down selector.
- Set the evaluation operator to like.
- Type the part or all of the table name in the entry field for the Table Name property.
- Click Apply. The source filter added to the list of filters and applied to Audit Events, returning an updated Audit Events list.
- Set the date range to the general time frame where the change occurred:
- Click the date-time field at the top right of the Audit Events page.
- To set the range, click Custom Range. The Selected Range field is enabled for input.
- In the left date field, use the field controls to specify the earliest date where the change may have occurred.
To include the entire day, set the time to indicate the beginning of the day, such as 12:01 AM.
- In the right date field, specify the latest date where the change may have occurred.
To include the entire day, set the time to indicate the end of the day, such as 11:59 PM.
- Click Apply.
- Review the results, looking at both the operation and the service name.
- If the results are too large, consider adding additional filters:
- By Service Name. For example, to show all Hive operations, use Service Name like hive.
- By Operation. For example, to show only Hive operations that change the table metadata, use Operation like alter.