Get Started with Hue
Hue is a web-based interactive query editor in the Hadoop stack that lets you visualize and share data.
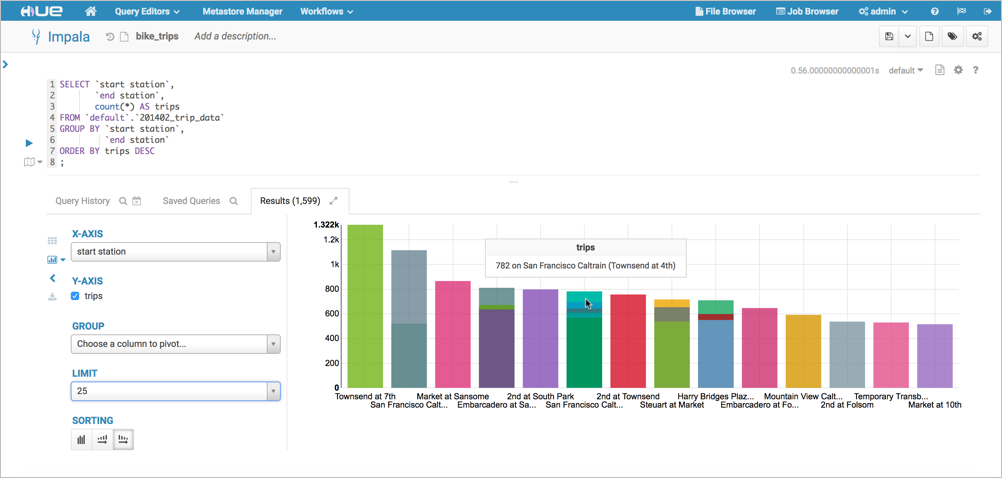
Impala Query Results in Hue
Play with Hue
Analyze and visualize your data with Impala, a high-speed, low-latency SQL query engine.
- Log on to Hue: select .
- Download and unzip one year of bike trips from the Bay Area Bike Share program (~80 MB).
- Create a table from ~/babs_open_data_year_1/201402_babs_open_data/201402_trip_data.csv.
- Go to the Metastore Tables Manager (or Tables Browser).
- In the default database, click the Create Table icon
 .
. - Set Type = File.
- Set Path by dragging 201402_trip_data.csv to the Path field.
- Set Formats (Comma, New Line, Double Quote) and click Next.
- Set Properties Format = Csv.
- Edit Fields and click Submit:
- Change ZipCode to data type string.
- Rename Bike # to Bike ID.
- Click Run
 to execute a
select query in Hive.
to execute a
select query in Hive.
- Go to .
- Click Refresh
 and
select Perform incremental metadata update to display your new table.
and
select Perform incremental metadata update to display your new table. - Input a query into the editor, for example:
select `start station`, `end station`, count(*) as trips from `default`.`201402_trip_data` group by `start station`, `end station` order by trips desc;
- Click Format
 to make
the query multi-line.
to make
the query multi-line. - Click Save
 , input a query
name, and click Save.
, input a query
name, and click Save. - Click Execute to run the
query.
- Click Refresh
- Create a Bar chart by clicking
 :
:
- Set the X-axis as start station and the Y-axis as trips. A bar chart displays.
- Set the Limit to 10.
- Create a Pie chart by clicking
 .
. - Download the results by clicking
 and selecting
CSV or Excel.
and selecting
CSV or Excel.
To learn more about the power of Hue, see Hue How-tos.
