
Defining Workload Views Manually
Steps for manually defining your workload views.
To view this feature in action, watch the following video:
Video: Classifying Workloads to Gain Insights
For better video quality, click YouTube in the lower right corner of the video player to watch this video on YouTube.com.
-
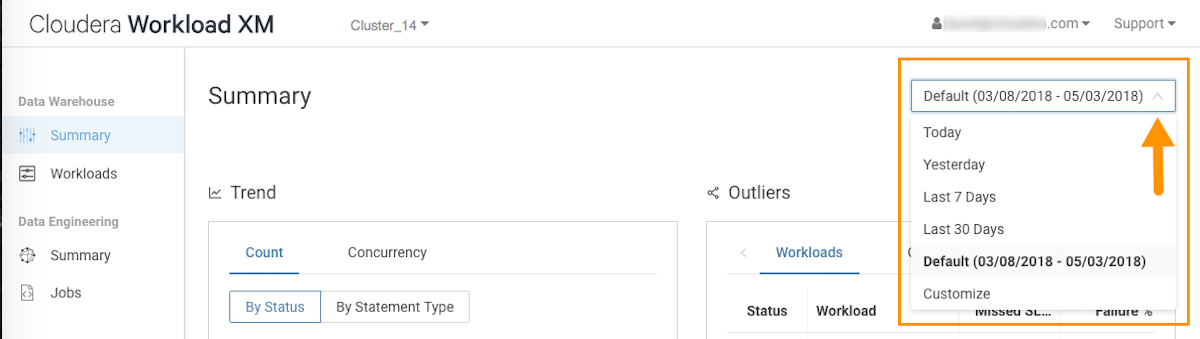
From the time-range list in the Cluster Summary page, select a time period that
meets your requirements.
-
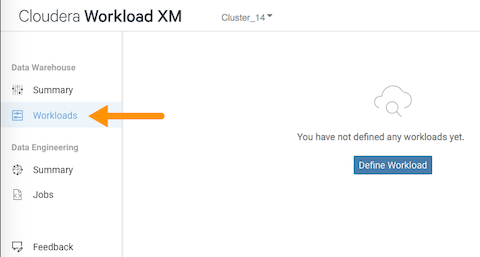
From the navigation panel under Data Warehouse, select
Workloads, and then click the Define
New list and select Manually define
view.
The Define Data Warehouse Workload View opens, where you can define a set of criteria that enables you to analyze a specific set of queries.For example, you can review all the failed queries using a specific database that are subject to a fifteen second SLA. For this example's view definition, a name is used that describes the view, as in applog_db_under_15s. Where the criteria will monitor queries that use the applog database, when 100 percent of these queries miss a 15s SLA, or when the total query execution time exceeds 15 seconds, then the workload is flagged with a failing status.: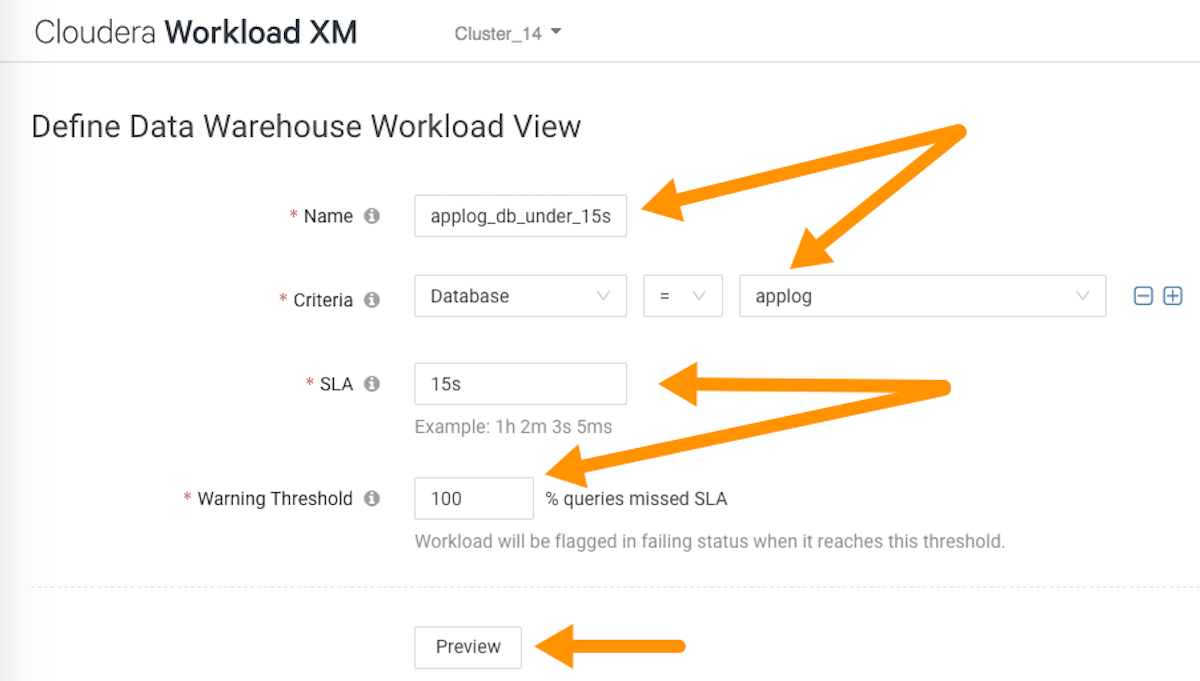
-
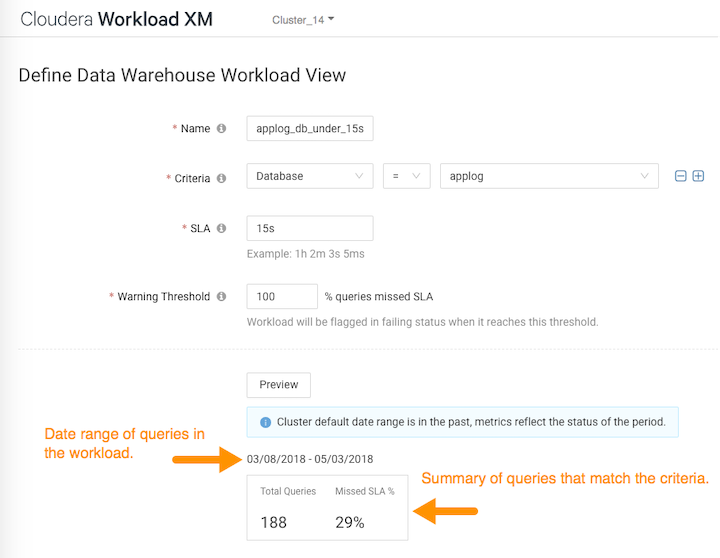
Click Preview, which displays a summary of the queries
matching this criteria:
-
When you are satisfied with the results, click
Save.
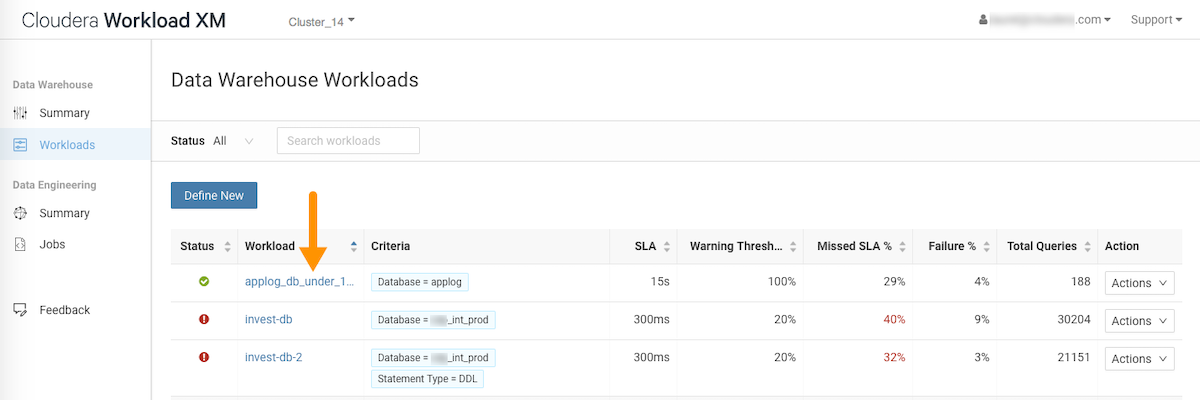
The Data Warehouse Workloads page opens and your workload view appears in the Workload column.
-
To view more information about the workloads using the view's formula, select
the name of the workload view.
The details page for your workload view opens visually displaying the views details as charts and tabs that you can use to analyze, as in this example, which visually displays how this group of queries is meeting its SLA:
- In the Trend section, you can display the counts of executing queries,
either By Status or By Statement
Type.
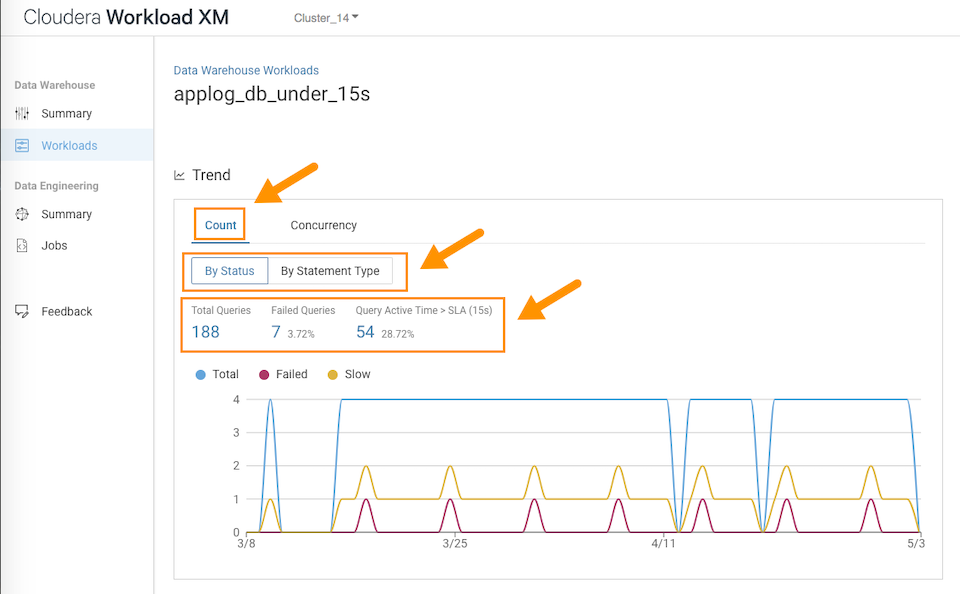
- To view further details, click the number under Total Queries, Failed Queries, and Query Active Time.
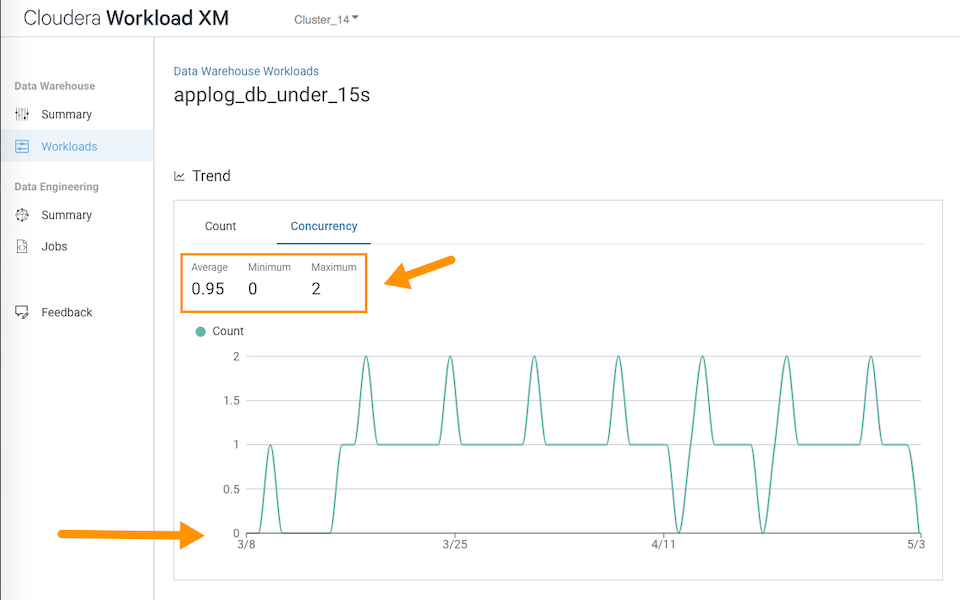
- To view the number of queries executing concurrently, click the
Concurrency tab.
In this example, the maximum concurrency for this view is 2. This indicates that for the queries flagged by this view, a maximum of only two queries access the same data at the same time during the specified time period. The graph, displays how the concurrency fluctuates over the date range specified for the workload view.
- In the Outliers section, you can display the
Slowest queries and the Most
Complex queries:
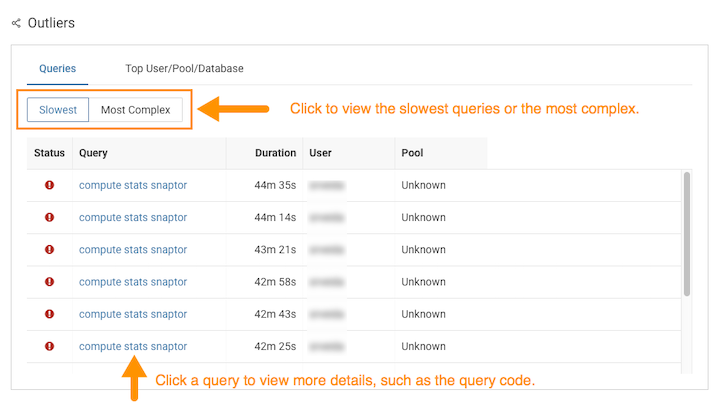
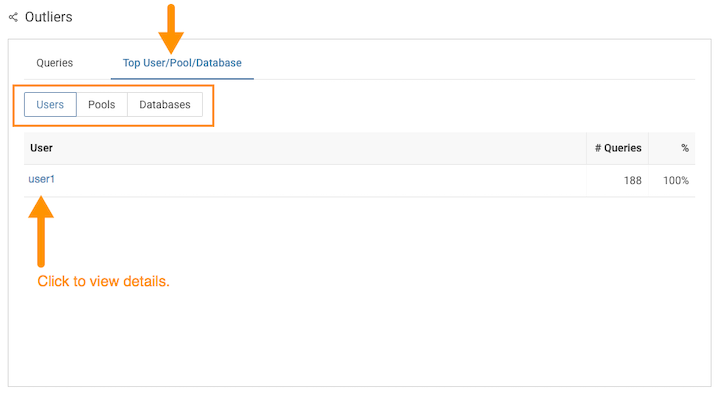
- You can also display the users who are executing the queries in your
workload view and the pools and databases being used. To view further
details about the specific queries being executed, click a user, pool,
or the database name:
- You can also display the different statement types contained in the workload view, the active time of the queries, and you can further drill down to view more granular details on each query.
- In the Trend section, you can display the counts of executing queries,
either By Status or By Statement
Type.
