
Heatmaps provides a graphical representation of your overall cluster utilization using simple color coding.
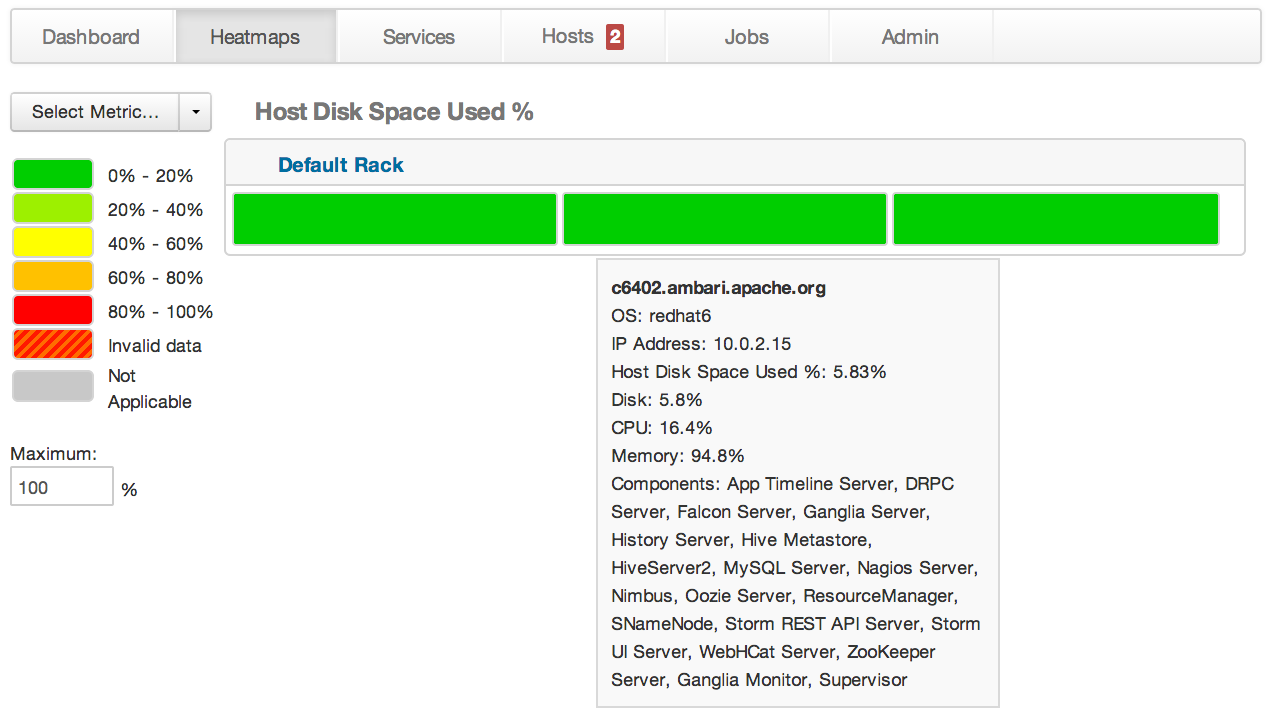
A colored block represents each host in your cluster. To see more information about a specific host, hover over the block representing the host in which you are interested. A pop-up window displays metrics about HDP components installed on that host. Colors displayed in the block represent usage in a unit appropriate for the selected set of metrics. If any data necessary to determine state is not available, the block displays "Invalid Data". Changing the default maximum values for the heatmap lets you fine tune the representation. Use the Select Metric drop-down to select the metric type.
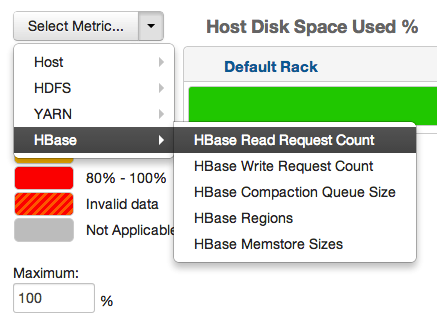
Heatmaps supports the following metrics:
| Metric | Uses |
| Host/Disk Space Used % | disk.disk_free and disk.disk_total |
| Host/Memory Used % | memory.mem_free and memory.mem_total |
| Host/CPU Wait I/O % | cpu.cpu_wio |
| HDFS/Bytes Read | dfs.datanode.bytes_read |
| HDFS/Bytes Written | dfs.datanode.bytes_written |
| HDFS/Garbage Collection Time | jvm.gcTimeMillis |
| HDFS/JVM Heap MemoryUsed | jvm.memHeapUsedM |
| YARN/Garbage Collection Time | jvm.gcTimeMillis |
| YARN / JVM Heap Memory Used | jvm.memHeapUsedM |
| YARN / Memory used % | UsedMemoryMB and AvailableMemoryMB |
| HBase/RegionServer read request count | hbase.regionserver.readRequestsCount |
| HBase/RegionServer write request count | hbase.regionserver.writeRequestsCount |
| HBase/RegionServer compaction queue size | hbase.regionserver.compactionQueueSize |
| HBase/RegionServer regions | hbase.regionserver.regions |
| HBase/RegionServer memstore sizes | hbase.regionserver.memstoreSizeMB |
