View Metrics that indicate the operating status of your cluster on a customizable mashup. Each metrics widget displays status information for a single service in your HDP cluster. The Ambari dashboard displays all metrics for the HDFS, YARN, HBase, and Storm services, and cluster-wide metrics by default.
![[Note]](../common/images/admon/note.png) | Note |
|---|---|
Metrics data for Storm is buffered and sent as a batch to Ambari every 5 minutes. After adding the Storm service, anticipate a five-minute delay for Storm metrics to appear. |
You can add and remove individual widgets, and rearrange the mashup by dragging and dropping each widget to a new location in the mashup.
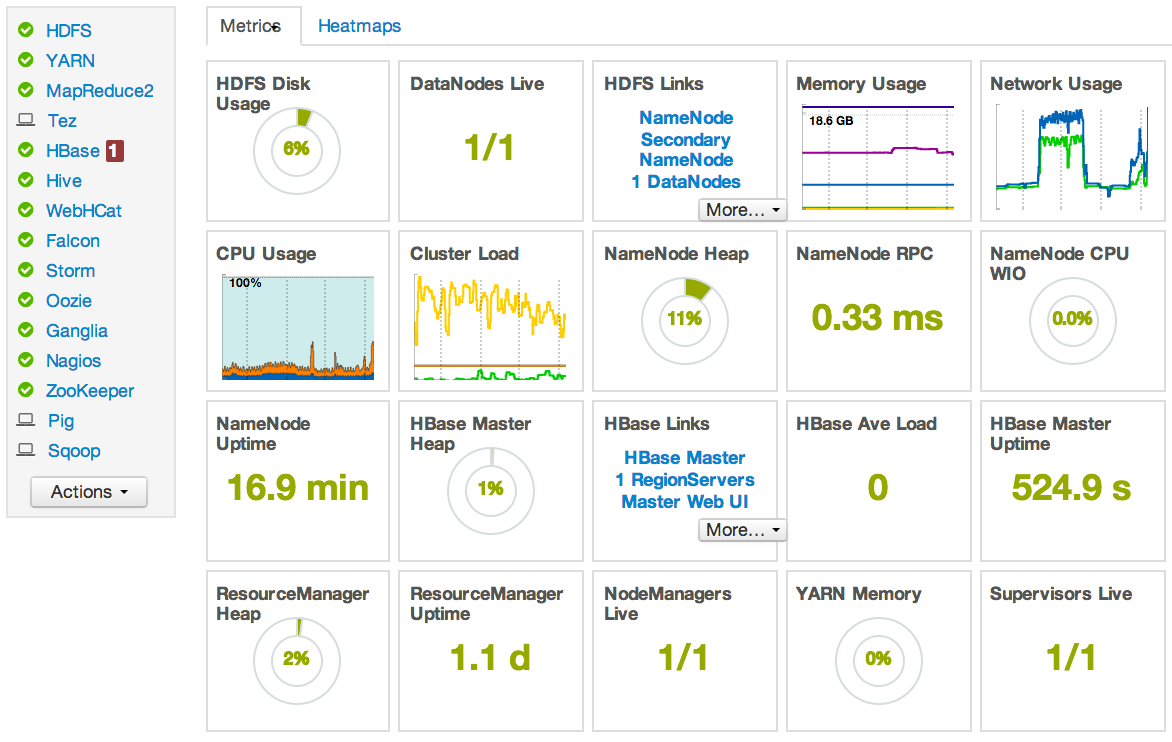
Status information appears as simple pie and bar charts, more complex charts showing usage and load, sets of links to additional data sources, and values for operating parameters such as uptime and average RPC queue wait times. Most widgets displays a single fact by default. For example, HDFS Disk Usage displays a load chart and a percentage figure. The Ambari Dashboard includes metrics for the following services:
Table 2.1. Ambari Service Metrics and Descriptions
| Metric: | Description: |
|---|---|
| HDFS | |
| HDFS Disk Usage |
The Percentage of DFS used, which is a combination of DFS and non-DFS used. |
| Data Nodes Live |
The number of DataNodes live, as reported from the NameNode. |
| NameNode Heap |
The percentage of NameNode JVM Heap used. |
| NameNode RPC |
The average RPC queue latency. |
| NameNode CPU WIO |
The percentage of CPU Wait I/O. |
| NameNode Uptime |
The NameNode uptime calculation. |
| YARN[a] | |
| ResourceManager Heap |
The percentage of ResourceManager JVM Heap used. |
| ResourceManager Uptime |
The ResourceManager uptime calculation. |
| NodeManagers Live |
The number of DataNodes live, as reported from the ResourceManager. |
| YARN Memory |
The percentage of available YARN memory (used vs. total available). |
| HBase | |
| HBase Master Heap |
The percentage of NameNode JVM Heap used. |
| HBase Ave Load |
The average load on the HBase server. |
| HBase Master Uptime |
The HBase Master uptime calculation. |
| Region in Transition |
The number of HBase regions in transition. |
| Storm[b] | |
| Supervisors Live |
The number of Supervisors live, as reported from the Nimbus server. |
| MapReduce[c] | |
| JobTracker Heap |
The percentage of JobTracker JVM Heap used. |
| TaskTrackers Live |
The number of TaskTrackers live, as reported from the JobTracker. |
[a] HDP 2.0 and 2.1 Stacks [b] HDP 2.1 Stack [c] HDP 1.3 Stack | |
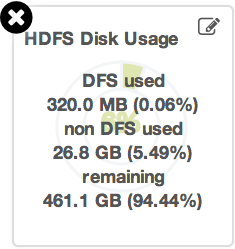
To see more detailed information about a service, hover your cursor over a Metrics widget.
More detailed information about the service displays, as shown in the following example:
To remove a widget from the mashup, click the white X.
To edit the display of information in a widget, click the pencil icon. For more information about editing a widget, see Customizing Metrics Display .
Cluster Metrics display information that represents your whole cluster. The Ambari Dashboard includes widgets that display the following cluster-wide metrics:

Table 2.2. Ambari Cluster-Wide Metrics and Descriptions
| Metric: | Description: |
|---|---|
| Memory Usage |
The cluster-wide memory utilization, including memory cached, swapped, used, shared. |
| Network Usage |
The cluster-wide network utilization, including in-and-out. |
| CPU Usage |
Cluster-wide CPU information, including system, user and wait IO. |
| Cluster Load |
Cluster-wide Load information, including total number of nodes. total number of CPUs, number of running processes and 1-min Load. |
To remove a widget from the dashboard, click the white X.
Hover your cursor over each cluster-wide metric to magnify the chart or itemize the widget display.
To remove or add metric items from each cluster-wide metric widget, select the item on the widget legend.
To see a larger view of the chart, select the magnifying glass icon.
Ambari displays a larger version of the widget in a pop-out window, as shown in the following example:
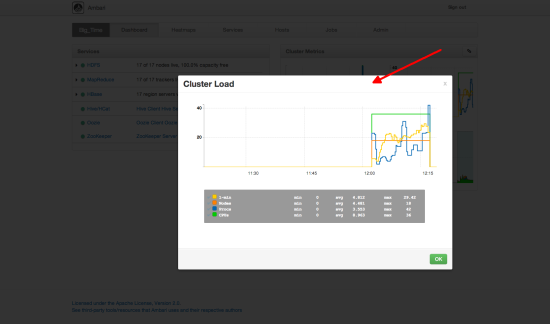
Use the pop-up window in the same ways that you use cluster-wide metric widgets on the dashboard.
To close the widget pop-up window, choose OK.
To replace a widget that has been removed from the dashboard:
Select the Metrics drop-down, as shown in the following example:
Choose Add.
Select a metric, such as Region in Transition.
Choose Apply.
To reset all widgets on the dashboard to display default settings:
Select the Metrics drop-down, as shown in the following example:
Choose Edit.
Choose Reset all widgets to default.
To view metrics for your cluster using the Ganglia UI:
Select the Metrics drop-down:
Choose Edit.
Choose View Metrics in Ganglia.
To customize the way a service widget displays metrics information:
Hover your cursor over a service widget.
Select the pencil-shaped, edit icon that appears in the upper-right corner.
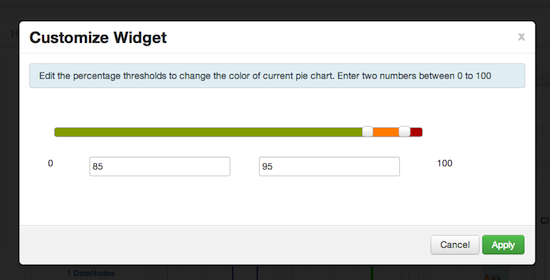
The Customize Widget pop-up window displays properties that you can edit, as shown in the following example.
Follow the instructions in the Customize Widget pop-up to customize widget appearance.
In this example, you can adjust the thresholds at which the HDFS Capacity bar chart changes color, from green to orange to red.
To save your changes and close the editor, choose Apply.
To close the editor without saving any changes, choose Cancel.
![[Note]](../common/images/admon/note.png) | Note |
|---|---|
Not all widgets support editing. |
The HDFS Links and HBase Links widgets list HDP components for which links to more metrics information, such as thread stacks, logs and native component UIs are available. For example, you can link to NameNode, Secondary NameNode, and DataNode components for HDFS, using the links shown in the following example:
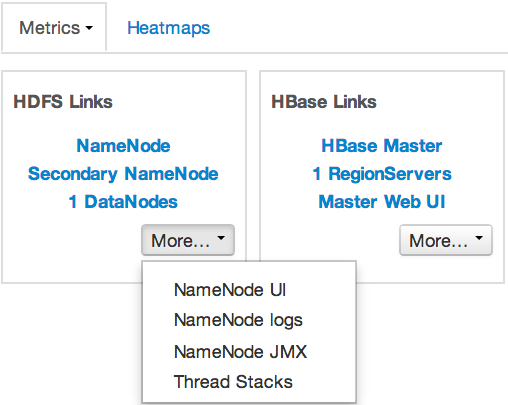
Choose the More drop-down to select from the list of links available for each service. The Ambari Dashboard includes More links to metrics for the following services:
Table 2.3. Links to More Metrics for HDP Services
| Service: | Metric: | Description: |
|---|---|---|
| HDFS | ||
| NameNode UI | Links to the NameNode UI. | |
| NameNode Logs |
Links to the NameNode logs. | |
| NameNode JMX |
Links to the NameNode JMX servlet. | |
| Thread Stacks |
Links to the NameNode thread stack traces. | |
| HBase | ||
| HBase Master UI |
Links to the HBase Master UI. | |
| HBase Logs |
Links to the HBase logs. | |
| ZooKeeper Info |
Links to ZooKeeper information. | |
| HBase Master JPX |
Links to the HBase Master JMX servlet. | |
| Debug Dump |
Links to debug information. | |
| Thread Stacks |
Links to the HBase Master thread stack traces. |

