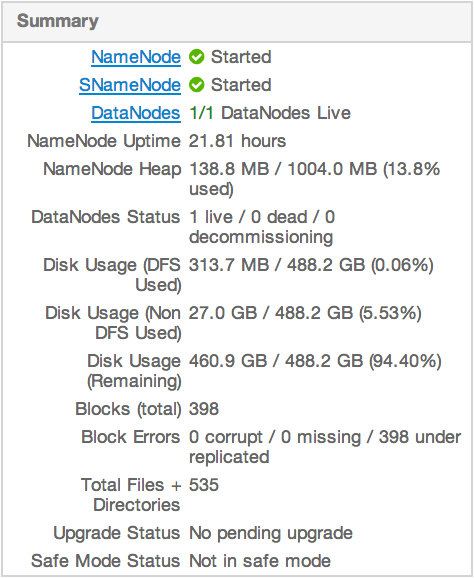
After you select a service, Summary tab displays basic information about the selected service.
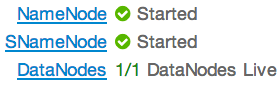
Select a View Host link, as shown in the following example, to view components and the host on which the selected service is running.
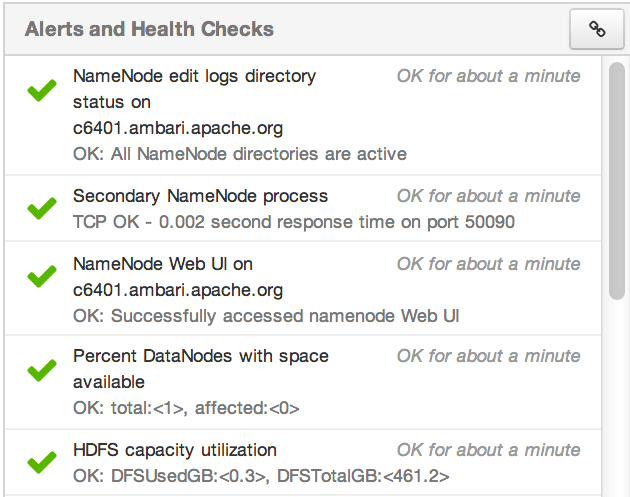
View results of the health checks performed on your cluster by Nagios in Alerts and Health Checks. Alerts and Health Checks displays a list of each issue and its rating, sorted first by descending severity, then by descending time. To access more detailed information, select the native Nagios GUI link located at the upper right corner of the panel. Use the Nagios credentials you set up during installation to log in to Nagios.