Functionality of Metron Dashboard
The Metron dashboard is a Kibana-based dashboard designed to identify, investigate, and analyze cybersecurity data. HCP supports Kibana 4.x. Kibana is an open source analytics and visualization platform.
The Metron dashboard displays all of the data on a single dashboard enabling you to filter through the irrelevant data and display just the information, alerts, and context for which you are looking. The Metron dashboard has several advantages over conventional SIEM tools, including flexibility, and the single pane of glass approach that displays all of the data on the same screen, requiring no jumping from console to console to gather the information.
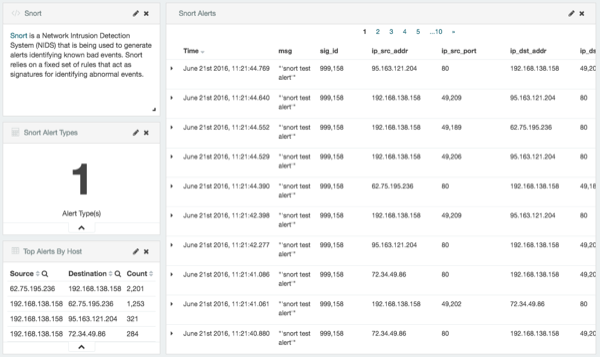
HCP supports two types of messages: metadata and alerts. By convention there should be one panel per metadata telemetry and one panel that is a "catch all" panel for alerts. The Snort panels are a good example of these two panel types. However, the Snort alerts panel only lists alerts from Snort because the default Metron dashboard contains only one data source that produces alerts.
When HCP parses the telemetry data on ingest, it extracts and normalizes different parts of the message into a standard Metron JSON. Standardizing and normalizing field names and format allows HCP to search different telemetry messages with a single query.
The first telemetry type that HCP supports is metadata messages. Metadata messages are parsed enriched messages in the JSON format.
The second telemetry type that HCP supports is alerts telemetries. Alerts telemetries
come from IDS sensors like Snort or mixed telemetries like application logs that contain some
metadata and some alert messages. While it is possible to set up a new panel for each alert
telemetry, it is more desirable to set up a single panel that contains all of the alerts. This
guarantees that the query will pull in alerts from multiple telemetries (even mixed mode
telemetries that have some metadata and some alerts associated with them). You can then set up
a detailed table containing only the alerts. To set telemetry as alert you need to set
is_alert = true. This is already set up for HCP under the "Alerts" table.
The fields displayed for each alerts table can be customized. Ideally you want the fields of most importance (as well as the standard fields that telemetries are correlated on) to be displayed.
The following table contains a description of each of the Kibana components in the Metron dashboard.
- Area Chart Panel
You can use the area chart panel for stacked timelines for which you want to see the total.
- Data Table Panel
Use the data table panel to provide a detail breakdown, in tabular format, of the results of a composed aggregation. You can generate a data table from many other charts by clicking the grey bar at the bottom of the chart.
- Detailed Message Panel
A detailed message panel displays the raw data from your search query.
- Document Table
When you submit a search query, the 500 most recent documents that match the query are listed in the Documents table which is displayed in the center of the Discover window.
- Field List
A list of all of the fields associated with a selected index pattern. This list is displayed on the left side of the Discover window.
- Line Chart Panel
Use the line chart when you want to display high density time series. This chart is useful for comparing one series with another.
- Mark Down Widget Panel
You can use the mark down widget panel to provide explanations or instructions for the dashboard.
- Metric Panel
You can use a metric panel to display a single large number such as the number of hits or the average of a numeric field.
- Pie Chart Panel
A pie chart is a circular statistical graphic that is ideal for displaying the parts of some whole.
- Tile Map Panel
The tile map panel type displays a map populated with your search results. This panel type requires an Elasticsearch geo_point field that is mapped as
type:geo_pointwith latitude and longitude coordinates.- Vertical Bar Chart Panel
You can use the vertical bar chart panel to display histograms. Histogram panels represent ingest rates for each individual telemetry. By convention, you should set up one for each type.


