Monitoring Impala Queries
The Impala Queries page displays information about Impala queries that are running and have run in your cluster. You can filter the queries by time period and by specifying simple filtering expressions.
Viewing Queries
- Do one of the following:
- Select .
- On the tab, select Impala service name and click the Queries tab.
| Action | Description |
|---|---|
| Filter the displayed queries | Create filter expressions manually, select preconfigured filters, or use the Workload Summary section to build a query interactively. See Filtering Queries. |
| Select additional attributes for display. | Click Select Attributes. Selected attributes also display as available filters in the Workload Summary section. To display information about attributes, hover over a field label. See Filter Attributes.
Only attributes that support filtering appear in the Workload Summary section. See the Attributes table. |
| View a histogram of the attribute values. | Click the  icon to the right of each
attribute displayed in the Workload Summary section. icon to the right of each
attribute displayed in the Workload Summary section. |
| Display charts based on the filter expression and selected attributes. | Cick the Charts tab. |
| View charts that help identify whether Impala best practices are being followed. | Click the Best Practices link. |
| Export a JSON file with the query results that you can use for further analysis. | Click Export. |
Configuring Impala Query Monitoring
You can configure the visibility of the Impala query results and the size of the storage allocated to Impala query results.
For information on how to configure whether admin and non-admin users can view all queries, only that user's queries, or no queries, see Configuring Query Visibility.
Query information is stored in-memory in a ring buffer. If you restart Service Monitor, all queries are lost, and older queries eventually are dropped. For information on how to configure the query store, see Configuring Impala Query Data Store Maximum Size.
Impala Best Practices
To open the Impala Best Practices page, click the Best Practices tab on the Impala service page. The page contains charts that include description of each best practice and how to determine if it is being followed. See the Impala documentation for more detail on each best practice and for additional best practices.
Adjust the time range to see data on queries run at different times. Click the charts to get more detail on individual queries. Use the filter box at the top right of the Best Practices page to adjust which data is shown on the page. For example, to see just the queries that took more than ten seconds, make the filter query_duration > 10s.
Create a trigger based on any best practice by choosing Create Trigger from the individual chart drop-down menu.
Results Tab
Queries appear on the Results tab, with the most recent at the top. Each query has summary and detail information. A query summary includes the
following default attributes: start and end timestamps, statement, duration, rows produced, user,
coordinator, database, and query type. For example:
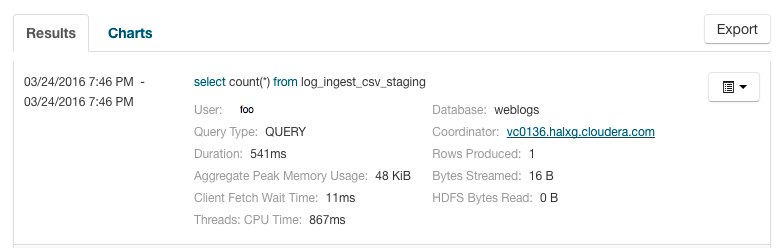
You can add additional attributes to the summary by clicking the Attribute Selector. In each query summary, the query statement is truncated if it is too long to display. To display the entire statement, click
 . To display
information about query attributes and possible values, hover over a field in a query. For example:
. To display
information about query attributes and possible values, hover over a field in a query. For example: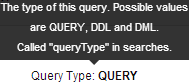
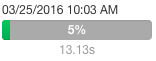
A running job displays a progress bar under the starting timestamp:
If an error occurred while processing the query,
 displays under the complete timestamp.
 to the right of each query listing to do the following. (Not
all options display, depending on the type of job.)
to the right of each query listing to do the following. (Not
all options display, depending on the type of job.)
- Query Details – Opens a details page for the job. See query details.
- User's Impala Queries – Displays a list of queries run by the user for the current job.
- Cancel (running queries only) – Cancel a running query (administrators only). Canceling a running query creates an audit event. When you cancel a query,
 replaces the progress bar.
 - Queries in the same YARN pool – Displays queries that use the same resource pool.
Filtering Queries
You filter queries by selecting a time range and specifying a filter expression in the search box.
You can use the Time Range Selector or a duration link (  ) to set the time range.
(See Time Line for details).
) to set the time range.
(See Time Line for details).
Filter Expressions
- Attribute - Query language name of the attribute.
- Operator - Type of comparison between the attribute and the attribute value. Cloudera Manager supports the standard comparator operators =, !=, >, <, >=, <=, and RLIKE. (RLIKE performs regular expression matching as specified in the Java Pattern class documentation.) Numeric values can be compared with all operators. String values can be compared with =, !=, and RLIKE. Boolean values can be compared with = and !=.
- Value - The value of the attribute. The value depends on the type of the attribute. For a Boolean value, specify either true or false. When specifying a string value, enclose the value in double quotes.
You create compound filter expressions using the AND and OR operators. When more than one operator is used in an expression, AND is evaluated first, then OR. To change the order of evaluation, enclose subexpressions in parentheses.
Compound Expressions
user = "root" AND rowsProduced > 100
executing = true AND (user = "Jack" OR user = "Jill")
Choosing and Running a Filter
- Do one of the following:
- Select a Suggested or Recently Run Filter
Click the
 to the right of the Search button to
display a list of sample and recently run filters, and select a filter. The filter text displays in the text box.
to the right of the Search button to
display a list of sample and recently run filters, and select a filter. The filter text displays in the text box. - Construct a Filter from the Workload Summary Attributes
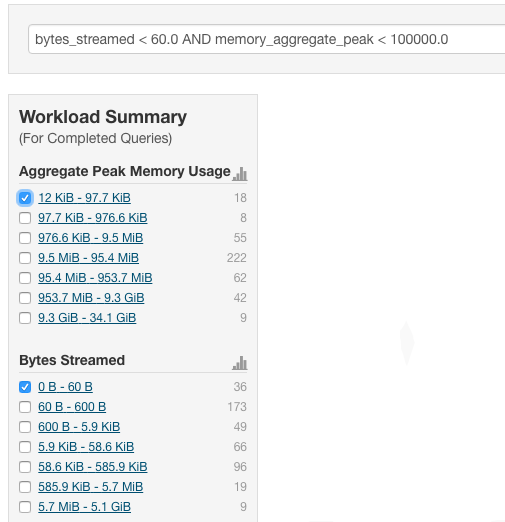
Optionally, click Select Attributes to display a dialog box where you can chose which attributes to display in the Workload Summary section. Select the checkbox next to one or more attributes, and click Close.
The attributes display in the Workload Summary section along with values or ranges of values that you can filter on. The values and ranges display as links with checkboxes. Select one or more checkboxes to add the range or value to the query. Click a link to run a query on that value or range. For example:
- Type a Filter
- Start typing or press Spacebar in the text box. As you type, filter attributes matching the typed letter display. If you press Spacebar, standard filter attributes display. These suggestions are part of typeahead, which helps build valid queries. For information about the attribute name and supported values for each field, hover over the field in an existing query.
- Select an attribute and press Enter.
- Press Spacebar to display a drop-down list of operators.
- Select an operator and press Enter.
- Specify an attribute value in one of the following ways:
- For attribute values that support typeahead, press Spacebar to display a drop-down list of values and press Enter.
- Type a value.
- Select a Suggested or Recently Run Filter
- Click in the text box and press Enter or click Search. The list displays the results that match the specified filter. The Workload Summary section refreshes to show only the values for the selected filter. The filter is added to the Recently Run list.
Filter Attributes
The following table includes available filter attributes and their names in Cloudera Manager, types, and descriptions.
| Display Name
(Attribute Name) |
Type | Supports Filtering? | Description |
|---|---|---|---|
| Admission Result
(admission_result) |
STRING | TRUE | The result of admission, whether immediately, queued, rejected, or timed out. Called 'admission_result' in searches. |
| Admission Wait Time
(admission_wait) |
MILLISECONDS | TRUE | The time from submission for admission to completion of admission. Called 'admission_wait' in searches. |
| Aggregate Peak Memory Usage
(memory_aggregate_peak) |
BYTES | TRUE | The highest amount of memory allocated by this query at a particular time across all nodes. Called 'memory_aggregate_peak' in searches. |
| Bytes Streamed
(bytes_streamed) |
BYTES | TRUE | The total number of bytes sent between Impala Daemons while processing this query. Called 'bytes_streamed' in searches. |
| Client Fetch Wait Time
(client_fetch_wait_time) |
MILLISECONDS | TRUE | The total amount of time the query spent waiting for the client to fetch row data. Called 'client_fetch_wait_time' in searches. |
| Client Fetch Wait Time Percentage
(client_fetch_wait_time_percentage) |
NUMBER | TRUE | The total amount of time the query spent waiting for the client to fetch row data divided by the query duration. Called 'client_fetch_wait_time_percentage' in searches. |
| Connected User
(connected_user) |
STRING | TRUE | The user who created the Impala session that issued this query. This is distinct from 'user' only if delegation is in use. Called 'connected_user' in searches. |
| Coordinator
(coordinator_host_id) |
STRING | TRUE | The host coordinating this query. Called 'coordinator_host_id' in searches. |
| Database
(database) |
STRING | TRUE | The database on which the query was run. Called 'database' in searches. |
| DDL Type
(ddl_type) |
STRING | TRUE | The type of DDL query. Called 'ddl_type' in searches. |
| Delegated User
(delegated_user) |
STRING | TRUE | The effective user for the query. This is set only if delegation is in use. Called 'delegated_user' in searches. |
| Duration
(query_duration) |
MILLISECONDS | TRUE | The duration of the query in milliseconds. Called 'query_duration' in searches. |
| Estimated per Node Peak Memory
(estimated_per_node_peak_memory) |
BYTES | TRUE | The planning process's estimate of per-node peak memory usage for the query. Called 'estimated_per_node_peak_memory' in searches. |
| Executing
(executing) |
BOOLEAN | FALSE | Whether the query is currently executing. Called 'executing' in searches. |
| File Formats
(file_formats) |
STRING | FALSE | An alphabetically sorted list of all the file formats used in the query. Called 'file_formats' in searches. |
| HBase Bytes Read
(hbase_bytes_read) |
BYTES | TRUE | The total number of bytes read from HBase by this query. Called 'hbase_bytes_read' in searches. |
| HBase Scanner Average Read Throughput
(hbase_scanner_average_bytes_read_per_second) |
BYTES_PER_SECOND | TRUE | The average HBase scanner read throughput for this query. This is computed by dividing the total bytes read from HBase by the total time spent reading by all HBase scanners. Called 'hbase_scanner_average_bytes_read_per_second' in searches. |
| HDFS Average Scan Range
(hdfs_average_scan_range) |
BYTES | TRUE | The average HDFS scan range size for this query. HDFS scan nodes that contained only a single scan range are not included in this computation. Low numbers for a query might indicate reading many small files which negatively impacts performance. Called 'hdfs_average_scan_range' in searches. |
| HDFS Bytes Read
(hdfs_bytes_read) |
BYTES | TRUE | The total number of bytes read from HDFS by this query. Called 'hdfs_bytes_read' in searches. |
| HDFS Bytes Read From Cache
(hdfs_bytes_read_from_cache) |
BYTES | TRUE | The total number of bytes read from HDFS that were read from the HDFS cache. This is only for completed queries. Called 'hdfs_bytes_read_from_cache' in searches. |
| HDFS Bytes Read From Cache Percentage
(hdfs_bytes_read_from_cache_percentage) |
NUMBER | TRUE | The percentage of all bytes read by this query that were read from the HDFS cache. This is only for completed queries. Called 'hdfs_bytes_read_from_cache_percentage' in searches. |
| HDFS Bytes Skipped
(hdfs_bytes_skipped) |
BYTES | TRUE | The total number of bytes that had to be skipped by this query while reading from HDFS. Any number above zero may indicate a problem. Called 'hdfs_bytes_skipped' in searches. |
| HDFS Bytes Written
(hdfs_bytes_written) |
BYTES | TRUE | The total number of bytes written to HDFS by this query. Called 'hdfs_bytes_written' in searches. |
| HDFS Local Bytes Read
(hdfs_bytes_read_local) |
BYTES | TRUE | The total number of local bytes read from HDFS by this query. This is only for completed queries. Called 'hdfs_bytes_read_local' in searches. |
| HDFS Local Bytes Read Percentage
(hdfs_bytes_read_local_percentage) |
NUMBER | TRUE | The percentage of all bytes read from HDFS by this query that were local. This is only for completed queries. Called 'hdfs_bytes_read_local_percentage' in searches. |
| HDFS Remote Bytes Read
(hdfs_bytes_read_remote) |
BYTES | TRUE | The total number of remote bytes read from HDFS by this query. This is only for completed queries. Called 'hdfs_bytes_read_remote' in searches. |
| HDFS Remote Bytes Read Percentage
(hdfs_bytes_read_remote_percentage) |
NUMBER | TRUE | The percentage of all bytes read from HDFS by this query that were remote. This is only for completed queries. Called 'hdfs_bytes_read_remote_percentage' in searches. |
| HDFS Scanner Average Read Throughput
(hdfs_scanner_average_bytes_read_per_second) |
BYTES_PER_SECOND | TRUE | The average HDFS scanner read throughput for this query. This is computed by dividing the total bytes read from HDFS by the total time spent reading by all HDFS scanners. Called 'hdfs_scanner_average_bytes_read_per_second' in searches. |
| HDFS Short Circuit Bytes Read
(hdfs_bytes_read_short_circuit) |
BYTES | TRUE | The total number of bytes read from HDFS by this query that used short-circuit reads. This is only for completed queries. Called 'hdfs_bytes_read_short_circuit' in searches. |
| HDFS Short Circuit Bytes Read Percentage
(hdfs_bytes_read_short_circuit_percentage) |
NUMBER | TRUE | The percentage of all bytes read from HDFS by this query that used short-circuit reads. This is only for completed queries. Called 'hdfs_bytes_read_short_circuit_percentage' in searches. |
| Impala Version
(impala_version) |
STRING | TRUE | The version of the Impala Daemon coordinating this query. Called 'impala_version' in searches. |
| Memory Accrual
(memory_accrual) |
BYTE_SECONDS | TRUE | The total accrued memory usage by the query. This is computed by multiplying the average aggregate memory usage of the query by the query's duration. Called 'memory_accrual' in searches. |
| Memory Spilled
(memory_spilled) |
BYTES | TRUE | Amount of memory spilled to disk. Called 'memory_spilled' in searches. |
| Network Address
(network_address) |
STRING | TRUE | The network address that issued this query. Called 'network_address' in searches. |
| Node with Peak Memory Usage
(memory_per_node_peak_node) |
STRING | TRUE | The node with the highest peak memory usage for this query. See Per Node Peak Memory Usage for the actual peak value. Called 'memory_per_node_peak_node' in searches. |
| Out of Memory
(oom) |
BOOLEAN | TRUE | Whether the query ran out of memory. Called 'oom' in searches. |
| Per Node Peak Memory Usage
(memory_per_node_peak) |
BYTES | TRUE | The highest amount of memory allocated by any single node that participated in this query. See Node with Peak Memory Usage for the name of the peak node. Called 'memory_per_node_peak' in searches. |
| Planning Wait Time
(planning_wait_time) |
MILLISECONDS | TRUE | The total amount of time the query spent waiting for planning to complete. Called 'planning_wait_time' in searches. |
| Planning Wait Time Percentage
(planning_wait_time_percentage) |
NUMBER | TRUE | The total amount of time the query spent waiting for planning to complete divided by the query duration. Called 'planning_wait_time_percentage' in searches. |
| Pool
(pool) |
STRING | TRUE | The name of the resource pool in which this query executed. Called 'pool' in searches. If YARN is in use, this corresponds to a YARN pool. Within YARN, a pool is referred to as a queue. |
| Query ID
(query_id) |
STRING | FALSE | The id of this query. Called 'query_id' in searches. |
| Query State
(query_state) |
STRING | TRUE | The current state of the query (running, finished, and so on). Called 'query_state' in searches. |
| Query Status
(query_status) |
STRING | TRUE | The status of the query. If the query hasn't failed the status will be 'OK', otherwise it will provide more information on the cause of the failure. Called 'query_status' in searches. |
| Query Type
(query_type) |
STRING | TRUE | The type of the query's SQL statement (DML, DDL, Query). Called 'query_type' in searches. |
| Resource Reservation Wait Time
(resources_reserved_wait_time) |
MILLISECONDS | TRUE | The total amount of time the query spent waiting for pool resources to become available . Called 'resources_reserved_wait_time' in searches. |
| Resource Reservation Wait Time Percentage
(resources_reserved_wait_time_percentage) |
NUMBER | TRUE | The total amount of time the query spent waiting for pool resources to become available divided by the query duration. Called 'resources_reserved_wait_time_percentage' in searches. |
| Rows Inserted
(rows_inserted) |
NUMBER | TRUE | The number of rows inserted by the query. Called 'rows_inserted' in searches. |
| Rows Produced
(rows_produced) |
NUMBER | TRUE | The number of rows produced by the query. Called 'rows_produced' in searches. |
| Service Name
(service_name) |
STRING | FALSE | The name of the Impala service. Called 'service_name' in searches. |
| Session ID
(session_id) |
STRING | TRUE | The ID of the session that issued this query. Called 'session_id' in searches. |
| Session Type
(session_type) |
STRING | TRUE | The type of the session that issued this query. Called 'session_type' in searches. |
| Statement
(statement) |
STRING | FALSE | The query's SQL statement. Called 'statement' in searches. |
| Statistics Missing
(stats_missing) |
BOOLEAN | TRUE | Whether the query was flagged with missing table or column statistics warning during the planning process. Called 'stats_missing' in searches. |
| Threads: CPU Time
(thread_cpu_time) |
MILLISECONDS | TRUE | The sum of the CPU time used by all threads of the query. Called 'thread_cpu_time' in searches. |
| Threads: CPU Time Percentage
(thread_cpu_time_percentage) |
NUMBER | TRUE | The sum of the CPU time used by all threads of the query divided by the total thread time. Called 'thread_cpu_time_percentage' in searches. |
| Threads: Network Receive Wait Time
(thread_network_receive_wait_time) |
MILLISECONDS | TRUE | The sum of the time spent waiting to receive data over the network by all threads of the query. A query will almost always have some threads waiting to receive data from other nodes in the query's execution tree. Unlike other wait times, network receive wait time does not usually indicate an opportunity for improving a query's performance. Called 'thread_network_receive_wait_time' in searches. |
| Threads: Network Receive Wait Time Percentage
(thread_network_receive_wait_time_percentage) |
NUMBER | TRUE | The sum of the time spent waiting to receive data over the network by all threads of the query divided by the total thread time. A query will almost always have some threads waiting to receive data from other nodes in the query's execution tree. Unlike other wait times, network receive wait time does not usually indicate an opportunity for improving a query's performance. Called 'thread_network_receive_wait_time_percentage' in searches. |
| Threads: Network Send Wait Time
(thread_network_send_wait_time) |
MILLISECONDS | TRUE | The sum of the time spent waiting to send data over the network by all threads of the query. Called 'thread_network_send_wait_time' in searches. |
| Threads: Network Send Wait Time Percentage
(thread_network_send_wait_time_percentage) |
NUMBER | TRUE | The sum of the time spent waiting to send data over the network by all threads of the query divided by the total thread time. Called 'thread_network_send_wait_time_percentage' in searches. |
| Threads: Storage Wait Time
(thread_storage_wait_time) |
MILLISECONDS | TRUE | The sum of the time spent waiting for storage by all threads of the query. Called 'thread_storage_wait_time' in searches. |
| Threads: Storage Wait Time Percentage
(thread_storage_wait_time_percentage) |
NUMBER | TRUE | The sum of the time spent waiting for storage by all threads of the query divided by the total thread time. Called 'thread_storage_wait_time_percentage' in searches. |
| Threads: Total Time
(thread_total_time) |
MILLISECONDS | TRUE | The sum of thread CPU, storage wait and network wait times used by all threads of the query. Called 'thread_total_time' in searches. |
| User
(user) |
STRING | TRUE | The effective user for the query. This is the delegated user if delegation is in use. Otherwise, this is the connected user. Called 'user' in searches. |
| Work CPU Time
(cm_cpu_milliseconds) |
MILLISECONDS | TRUE | Attribute measuring the sum of CPU time used by all threads of the query, in milliseconds. Called 'work_cpu_time' in searches. For Impala queries, CPU time is calculated based on the 'TotalCpuTime' metric. For YARN MapReduce applications, this is calculated from the 'cpu_milliseconds' metric. |
Examples
Consider the following filter expressions: user = "root", rowsProduced > 0, fileFormats RLIKE ".TEXT.*", and executing = true. In the examples:
- The filter attributes are user, rowsProduced, fileFormats, and executing.
- The operators are =, >, and RLIKE.
- The filter values are root, 0, .TEXT.*, and true.
