For better video quality, click YouTube in the
lower right corner of the video player to watch this video on
YouTube.com.
In a supported browser, log in to Workload XM.
In the Search field of the Clusters page, enter the name of the cluster whose
workloads you want to analyze.
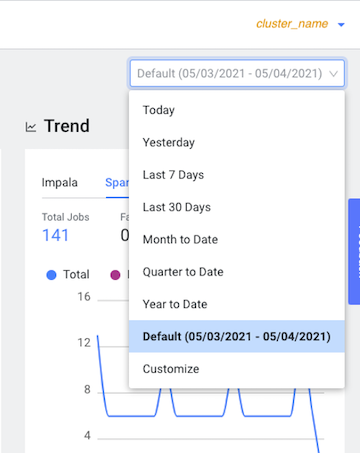
From the time-range list in the Cluster Summary page, select a time period that
meets your requirements.
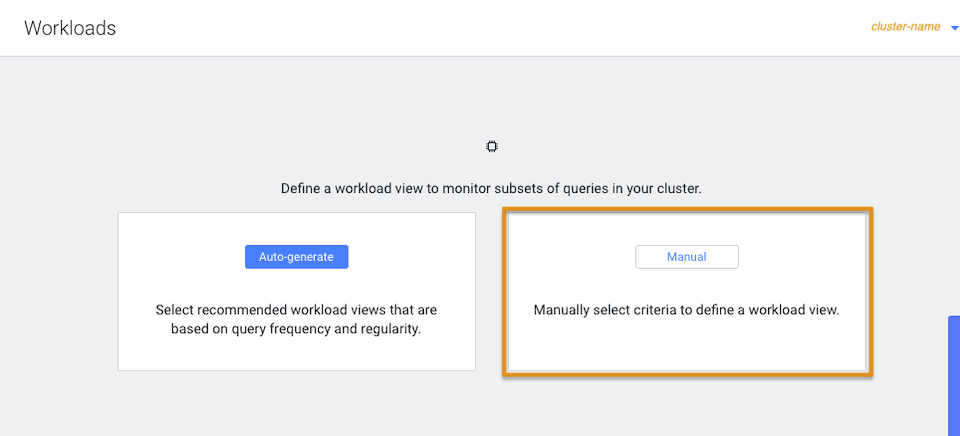
From the navigation panel, select Workloads.
In the Workloads page, click Manual:
The Define Workload View widget opens, where you define
a set of criteria that enables you to analyze a specific set of queries.
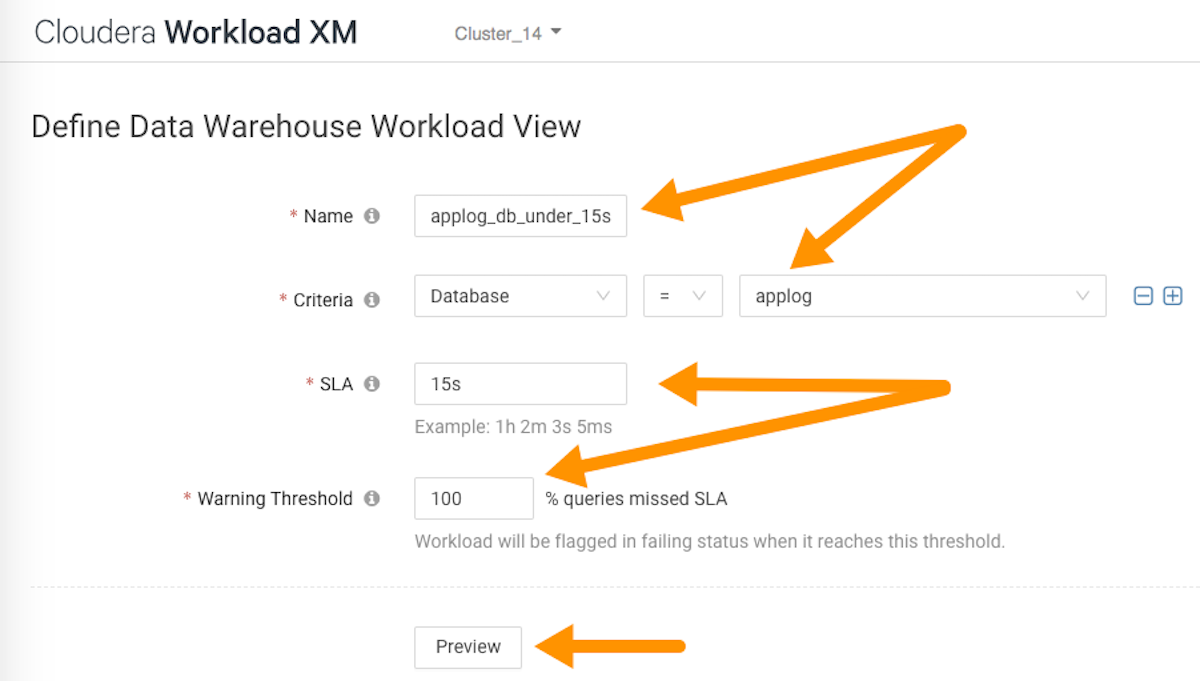
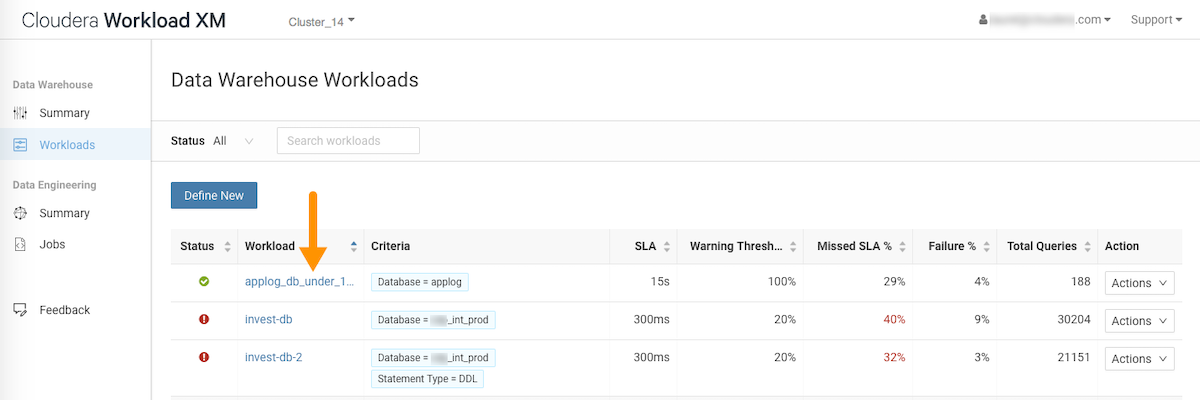
For example, as shown in the image below, you can list the total amount of
failed queries, as a percentage, from a specific database that are subject to a
fifteen second SLA.
Where, as defined by the criteria condition, Workload XM will monitor all
query jobs from the applog database. When the total query
execution time exceeds 15 seconds, as defined by the SLA condition, for 100
percent of these queries, as defined by the Warning Threshold, the workload is
flagged with a failed state:
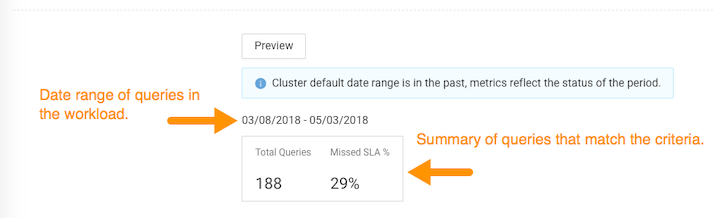
(Optional) To display a summary of the queries matching your criteria, click
Preview. As shown in the following example:
When you are satisfied with the results, click
Save.
The Workloads page opens and your workload view appears in the
Workload column.
(Optional) To view more information about the workloads using the view's
formula, open the workload's details page by clicking the name of the workload
view in the Workload column, which visually displays the
view's details as widgets that you can use to further analyze the results.
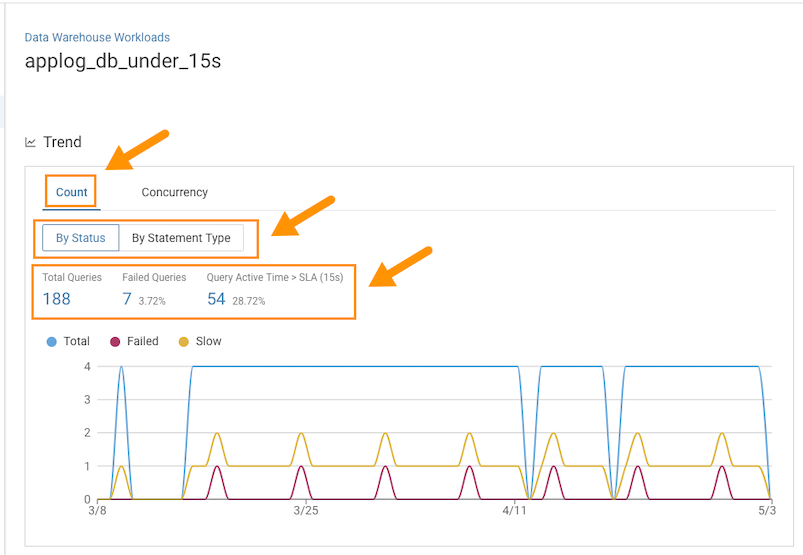
The following examples, display how this group of queries are meeting the
Workload view's SLA in the Trend chart, where:
The Count tab, displays the number of executing
queries, either By Status or By
Statement Type. To view further details, click the value
under Total Queries, Failed
Queries, and Query Active Time.
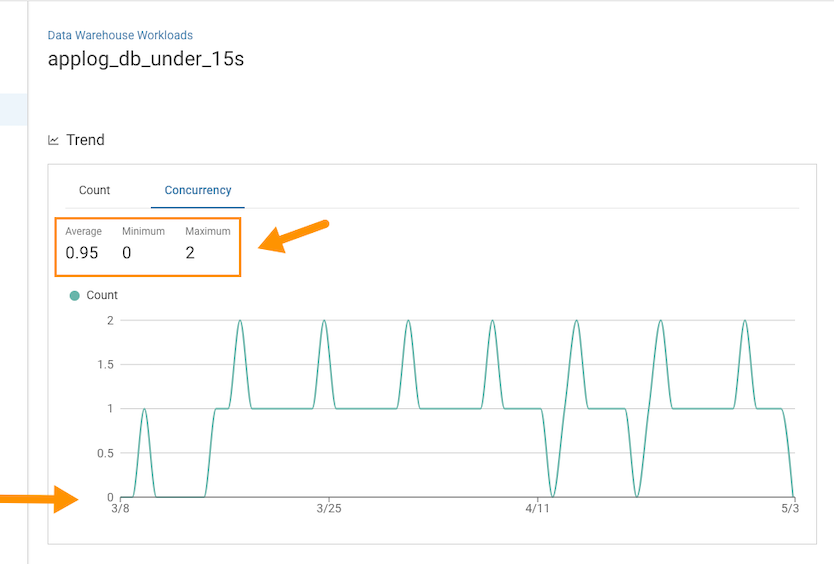
The Concurrency tab, displays the number of
queries executing concurrently.
In the following example, the maximum
concurrency for this view is 2. This
indicates that for the queries monitored by this view, only two
queries accessed the same data at the same time during the specified
time period. The graph view displays how the concurrency fluctuates
over the date range specified for the workload view.
We want your opinion
How can we improve this page?
What kind of feedback do you have?
This site uses cookies and related technologies, as described in our privacy policy, for purposes that may include site operation, analytics, enhanced user experience, or advertising. You may choose to consent to our use of these technologies, or