

Summary Page
While the NiFi canvas is useful for understanding how the configured DataFlow is laid out, this view is not always optimal when trying to discern the status of the system. In order to help the user understand how the DataFlow is functioning at a higher level, NiFi provides a Summary page. This page is available in the Global Menu in the top-right corner of the User Interface. See the NiFi User Interface section for more information about the location of this toolbar.
The Summary Page is opened by selecting Summary from the Global Menu. This opens the Summary table dialog:
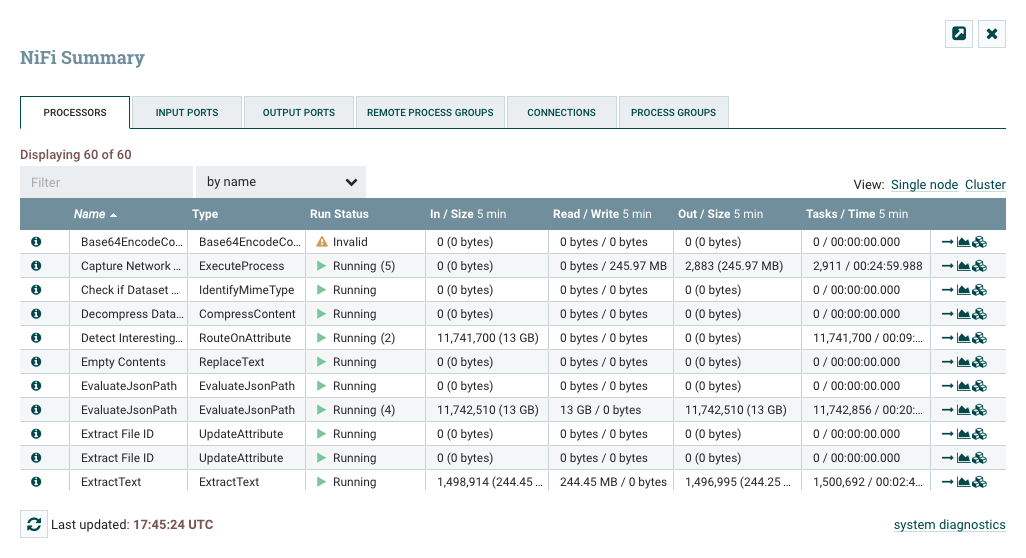
This dialog provides a great deal of information about each of the components on the canvas. Below, we have annotated the different elements within the dialog in order to make the discussion of the dialog easier.
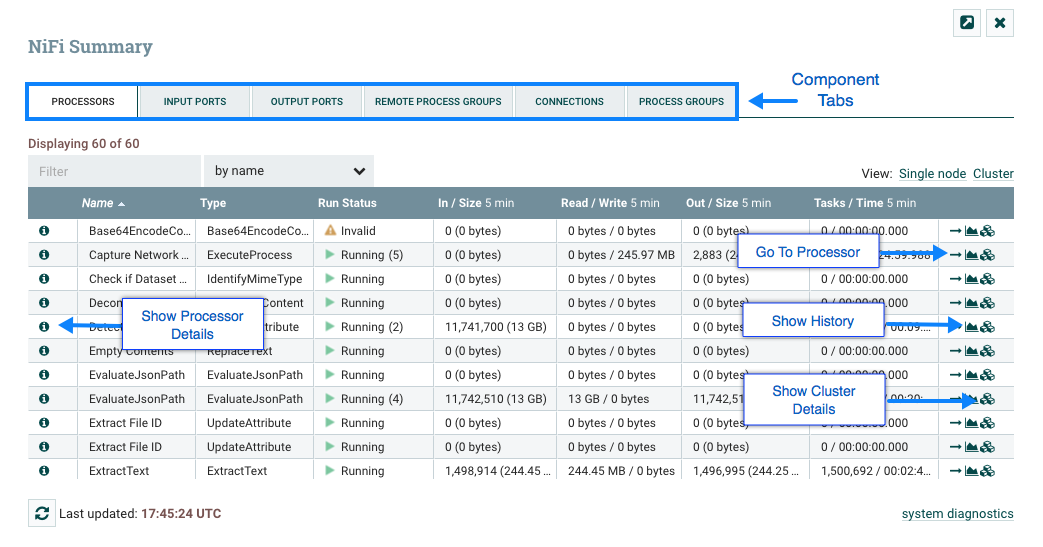
The Summary page is primarily comprised of a table that provides information about each of the components on the canvas. Above this table is a set of five tabs that can be used to view the different types of components. The information provided in the table is the same information that is provided for each component on the canvas. Each of the columns in the table may be sorted by clicking on the heading of the column. For more on the types of information displayed, see the sections Anatomy of a Processor, Anatomy of a Process Group, and Anatomy of a Remote Process Group above.
The Summary page also includes the following elements:
Bulletin Indicator: As in other places throughout the User Interface, when this icon is present, hovering over the icon will provide information about the Bulletin that was generated, including the message, the severity level, the time at which the Bulletin was generated, and (in a clustered environment) the node that generated the Bulletin. Like all the columns in the Summary table, this column where bulletins are shown may be sorted by clicking on the heading so that all the currently existing bulletins are shown at the top of the list.
Details: Clicking the Details icon will provide the user with the details of the component. This dialog is the same as the dialog provided when the user right-clicks on the component and chooses the "View configuration" menu item.
Go To: Clicking this button will close the Summary page and take the user directly to the component on the NiFi canvas. This may change the Process Group that the user is currently in. This icon is not available if the Summary page has been opened in a new browser tab or window (by clicking the "Pop Out" button, as described below).
Status History: Clicking the Status History icon will open a new dialog that shows a historical view of the statistics that are rendered for this component. See the section Historical Statistics of a Component for more information.
Refresh: The Refresh button allows the user to refresh the information displayed without closing the dialog and opening it again. The time at which the information was last refreshed is shown just to the right of the Refresh button. The information on the page is not automatically refreshed.
Filter: The Filter element allows users to filter the contents of the Summary table by typing in all or part of some criteria, such as a Processor Type or Processor Name. The types of filters available differ according to the selected tab. For instance, if viewing the Processor tab, the user is able to filter by name or by type. When viewing the Connections tab, the user is able to filter by source, by name, or by destination name. The filter is automatically applied when the contents of the text box are changed. Below the text box is an indicator of how many entries in the table match the filter and how many entries exist in the table.
Pop-Out: When monitoring a flow, it is helpful to be able to open the Summary table in a separate browser tab or window. The Pop-Out button, next to the Close button, will cause the entire Summary dialog to be opened in a new browser tab or window (depending on the configuration of the browser). Once the page is "popped out", the dialog is closed in the original browser tab/window. In the new tab/window, the Pop-Out button and the Go-To button will no longer be available.
System Diagnostics: The System Diagnostics window provides information about how the system is performing with respect to system resource utilization. While this is intended mostly for administrators, it is provided in this view because it does provide a summary of the system. This dialog shows information such as CPU utilization, how full the disks are, and Java-specific metrics, such as memory size and utilization, as well as Garbage Collection information.