
NiFi User Interface
The NiFi UI provides mechanisms for creating automated dataflows, as well as visualizing, editing, monitoring, and administering those dataflows. The UI can be broken down into several segments, each responsible for different functionality of the application. This section provides screenshots of the application and highlights the different segments of the UI. Each segment is discussed in further detail later in the document.
When the application is started, the user is able to navigate to the UI by going to the
default address of http://<hostname>:8080/nifi in a web browser.
There are no permissions configured by default, so anyone is able to view and modify the
dataflow. For information on securing the system, see the System Administrator's Guide.
When a DFM navigates to the UI for the first time, a blank canvas is provided on which a dataflow can be built:
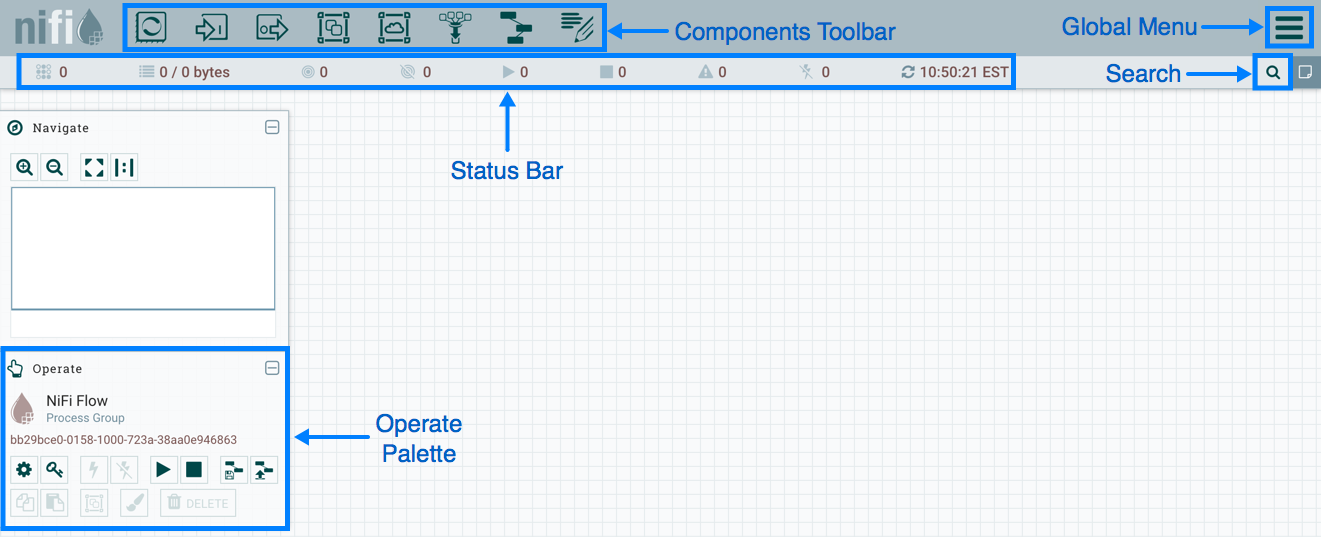
The Components Toolbar runs across the top left portion of your screen. It consists of the components you can drag onto the canvas to build your dataflow. Each component is described in more detail in Building a Dataflow.
The Status Bar is under the Components Toolbar. The Status bar provides information about how many Processors exist on the canvas in each state (Stopped, Running, Invalid, Disabled), how many Remote Process Groups exist on the canvas in each state (Transmitting, Not Transmitting), the number of threads that are currently active in the flow, the amount of data that currently exists in the flow, and the timestamp at which all of this information was last refreshed. Additionally, if the instance of NiFi is clustered, the Status bar shows how many nodes are in the cluster and how many are currently connected.
The Operate Palette sits to the left-hand side of the screen. It consists of buttons that are used by DFMs to manage the flow, as well as by administrators who manage user access and configure system properties, such as how many system resources should be provided to the application.
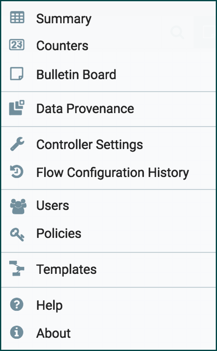
On the right side of the canvas is Search, and the Global Menu. You can use Search to easily find components on the canvas and can to search by component name, type, identifier, configuration properties, and their values. The Global Menu contains options that allow you to manipulate existing components on the canvas:
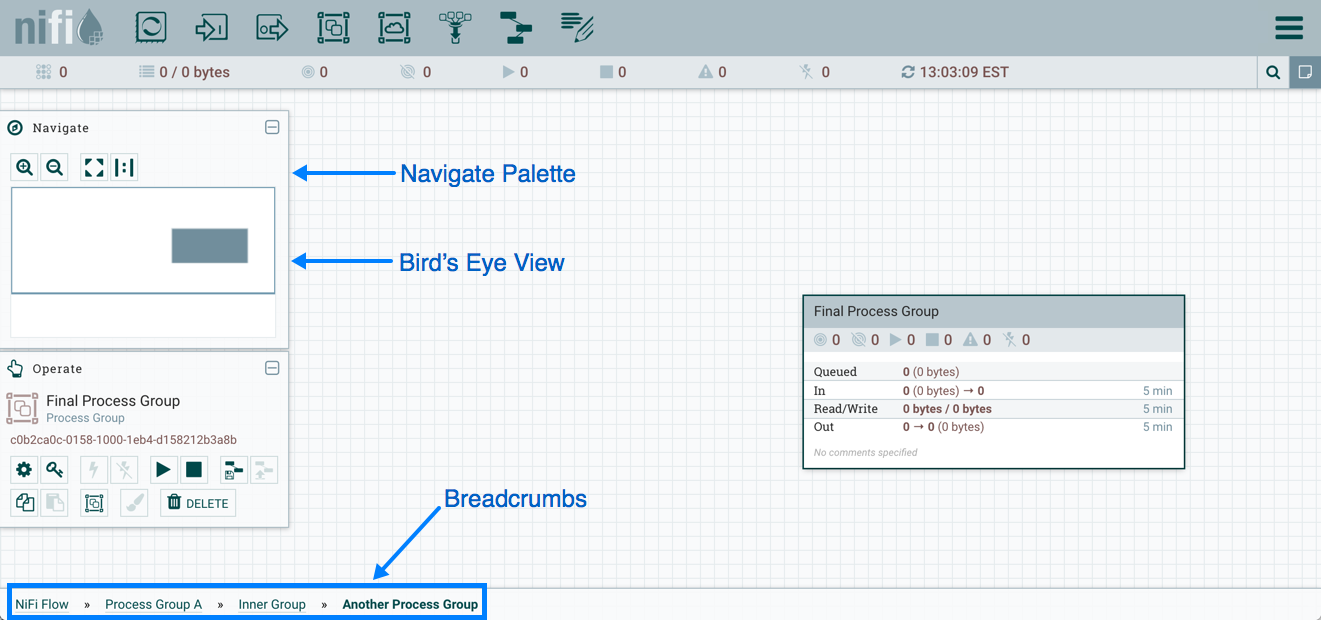
Additionally, the UI has some features that allow you to easily navigate around the canvas. You can use the Navigate Palette to pan around the canvas, and to zoom in and out. The "Birds Eye View" of the dataflow provides a high-level view of the dataflow and allows you to pan across large portions of the dataflow. You can also find breadcrumbs along the bottom of the screen. As you navigate into and out of Process Groups, the breadcrumbs show the depth in the flow, and each Process Group that you entered to reach this depth. Each of the Process Groups listed in the breadcrumbs is a link that will take you back up to that level in the flow.