Enabling or disabling case sensitive dashboard filters
By default, Data Visualization processes all parameter data in case-sensitive manner. It also has an option for disabling case-sensitive comparison on dashboard settings.
This example demonstrates how to create a simple dashboard with a refresh rate through using a URL link visual to access live information about the 2017 French Presidential election.
- To enable dashboards to use case-sensitive names in output parameters, navigate to
the General menu, and select the Parameter names are
case sensitive option.

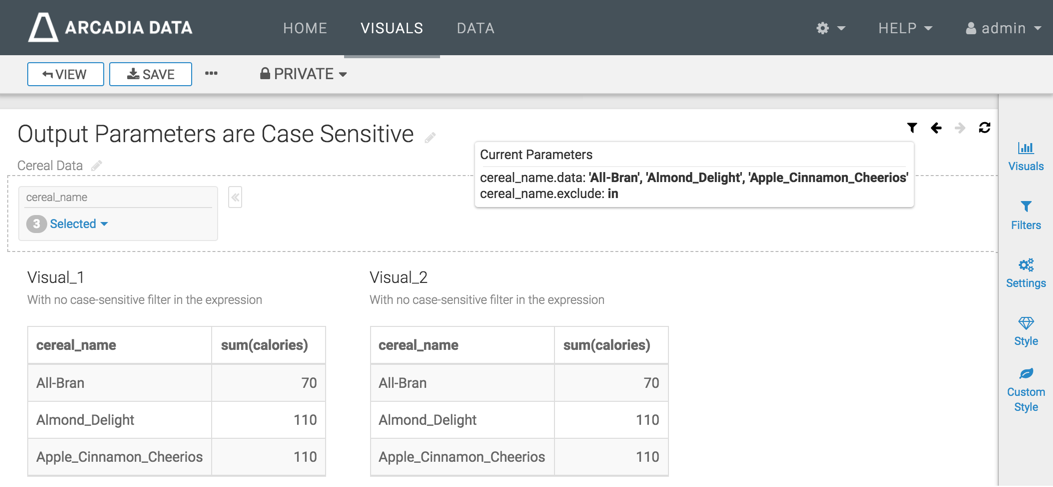
- To disable case-sensitive comparison, de-select this option. The following image shows Visual_1 and Visual_2. They do not use a case-sensitive output parameter filter. You can compare them before applying the case-sensitive filter. Note that the visuals look the same.


