
Showing borders around visuals
You can add borders to create a frame around visuals in a dashboard in CDP Data Visualization.

For example, compare the two visuals: one with a hidden border, and the other with a border showing.
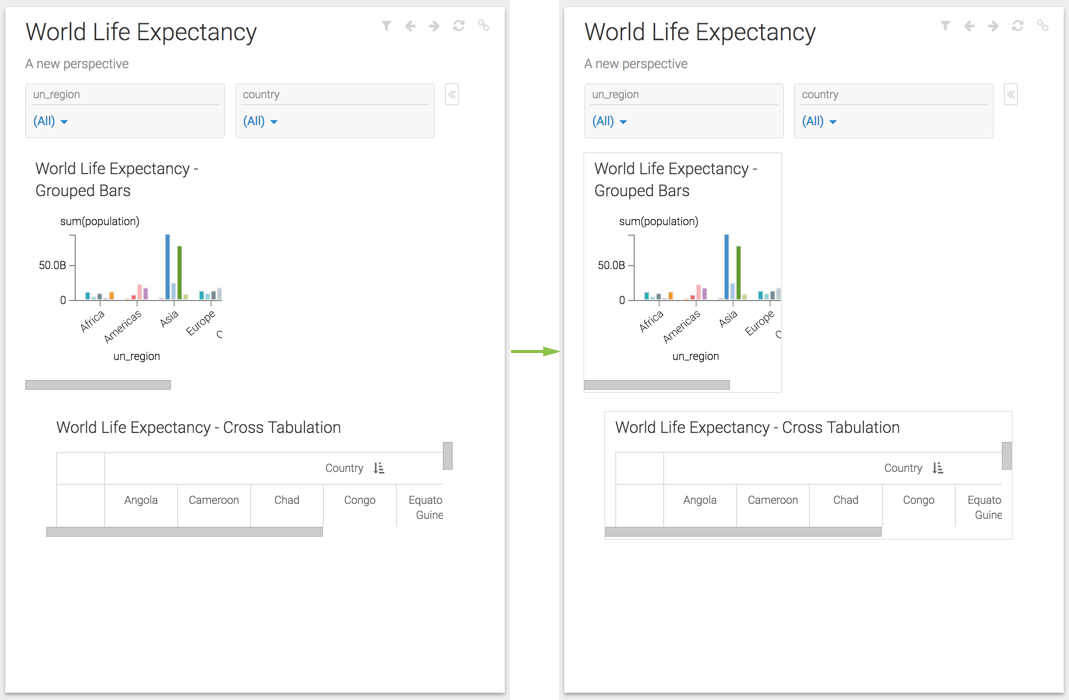
You can add borders to create a frame around visuals in a dashboard in CDP Data Visualization.
For example, compare the two visuals: one with a hidden border, and the other with a border showing.
What kind of feedback do you have?
