Showing or hiding an axis
CDP Data Visualization enables you to show or hide an axis. By default, all visuals display horizontal and vertical axes when they have directionality.
A visual may have a Dimension Axis and Measure Axis, or an X Axis and Y Axis.
To hide an axis, navigate to the Axes menu, and de-select the appropriate options.
For visuals that use Dimensions and Measures, the options are Show dimension axis, or Show measure axis, or both.

For visuals that use X axis and Y axis, the options are Show X Axis, or Show Y Axis, or both.

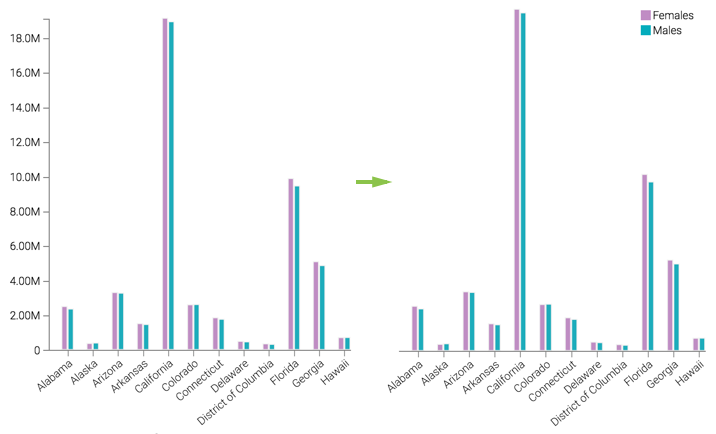
For example, hiding the Y axis label changes a visual in the following way: