Adding custom mapbox style
CDP Data Visualization enables you to add a custom mapbox style in an interactive map visual.
To create a choropleth map in an Interactive Map visual, you need a Custom Mapbox style and a Layer ID.
When you request for a custom style from Mapbox, make sure that this style has a choropleth shape file in it. This shape file has the choropleth Layer ID, which is the name of a unique layer within the Custom Mapbox style that identifies the shapes that you would like to color by a measure in your data. See Specifying a Choropleth Layer ID.
- On the right side of Visual Designer, click the
Settings menu.
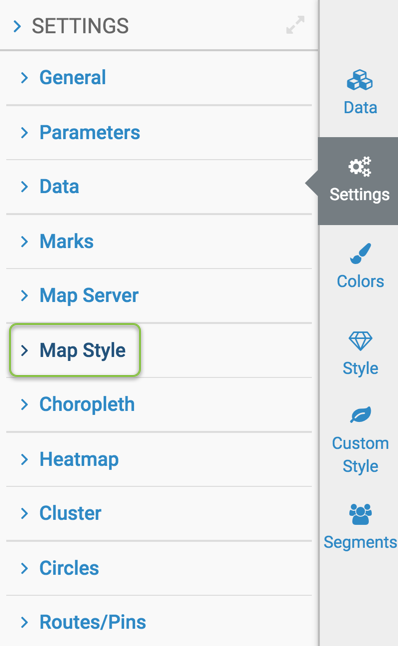
- In the Settings menu, click Map
Style.
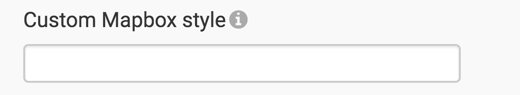
- To add a custom mapbox style that you got from Mapbox, enter the custom mapbox
style in the Custom Mapbox style option text box.