Create a dashboard
Learn how you can create a dashboard in CDP Data Visualization.
- There are several possible starting points for creating new dashboards:
- Click NEW DASHBOARD on the main HOME interface, in the top right corner on the side panel.
- Click NEW DASHBOARD on the main VISUALS interface, in the top left corner.
- Click the new dashboard icon next to the name of a particular dataset on the DATA interface.
- Click NEW DASHBOARD in the top right corner when in the Dataset Detail view for a particular dataset.
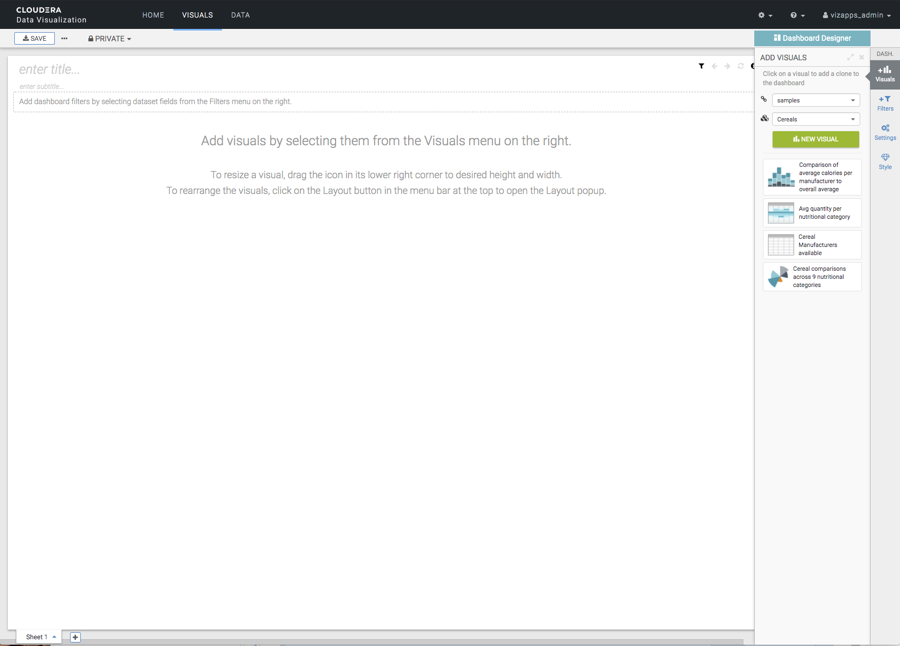
The Dashboard Designer opens on an empty dashboard.

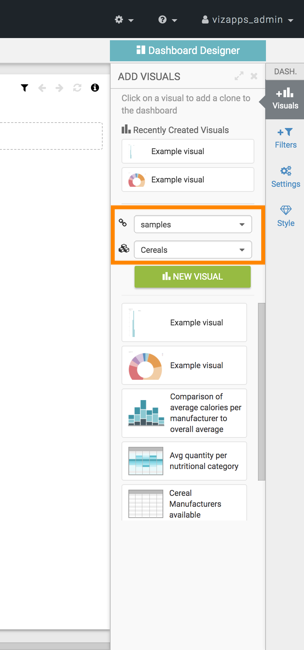
- Check the dataset of the dashboard In the Visuals menu of
the Dashboard Designer, and change it if needed.

-
In the Visuals menu, click NEW VISUAL to
add a new visual to the dashboard.
- Add a title for the dashboard. Optionally, you can also add a subtitle.
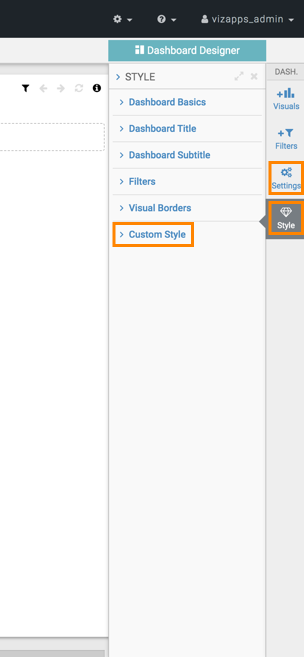
- [Optional] You can customize Settings,
Styles, and Custom Styles for the
dashboard in the Dashboard Designer side menu bar.

- Click SAVE in the top left corner.


