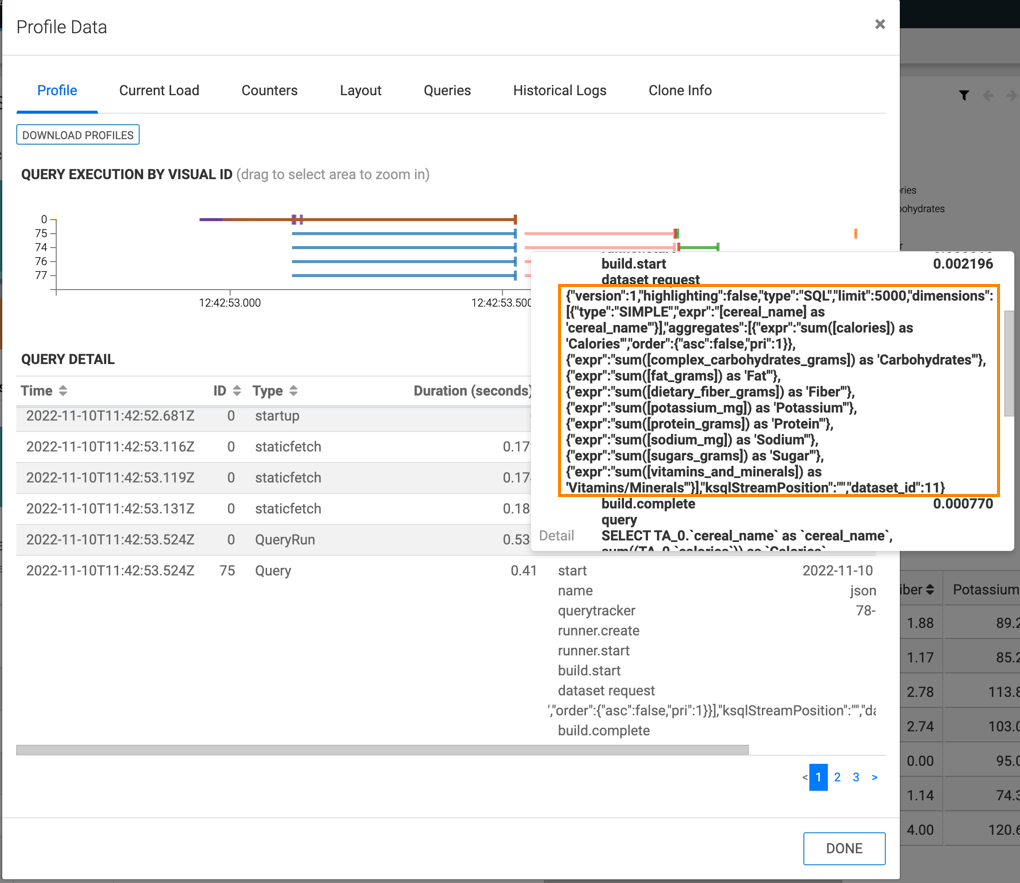
To avoid creating Data API requests from scratch, CDP Data Visualization provides access to details of the data requests.
-
Add the following settings in Advanced Site Settings section of
the Site Settings page:
ENABLE_DSREQ_PERF_DISPLAY = True
COMPRESS_DSREQ = True
-
Restart the CDP Data Visualization service.
-
Open an existing dashboard.
In this example, we selected Cereals.
-
Use the keyboard shortcut Shift +
Control/Cmd +
G to open the Performance
Profile interface.
-
Hover over a line that represents a visual ID, we selected
75,
and view the duration, type, and details of the query that runs against that visual.
The query uses the same API and includes the details of the data requests. You can use
this dataset request as the payload for your Data API call.

