
Showing points
This task applies to Line charts, Area charts, and Combined Bar/Line charts.
To show the individual data points, navigate to the Marks menu, and select the Show Points option.

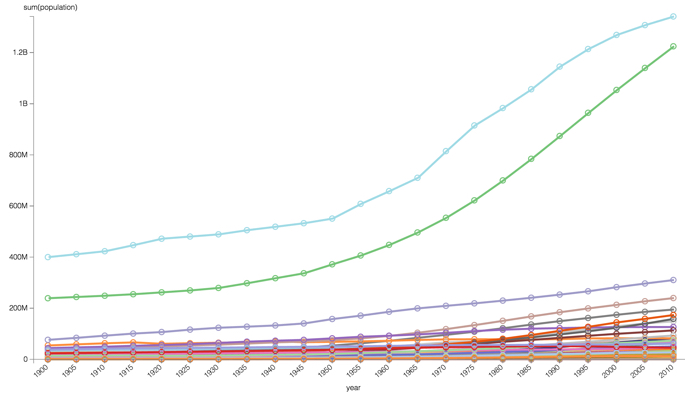
Note how the points appear on a visual.
This task applies to Line charts, Area charts, and Combined Bar/Line charts.
To show the individual data points, navigate to the Marks menu, and select the Show Points option.
Note how the points appear on a visual.
What kind of feedback do you have?
