Displaying gauge line on qualitative arc
In a Gauge visual, CDP Data Visualization enables you to compare the measure value to the maximum qualitative range.
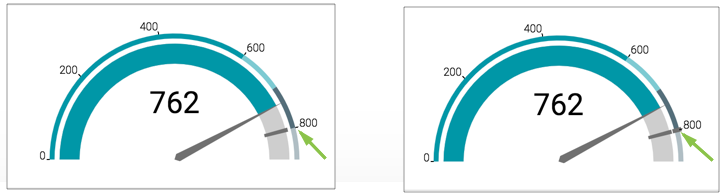
To show a compare line on the qualitative arc, navigate to the Marks menu, and select the Display compare line on qualitative arc option.

In the second image, note the presence of a gauge line on the qualitative arc.