
Creating a dashboard with date filters
In , the quick date filter enables you to provide a quick selection of date ranges for visualizing your data.
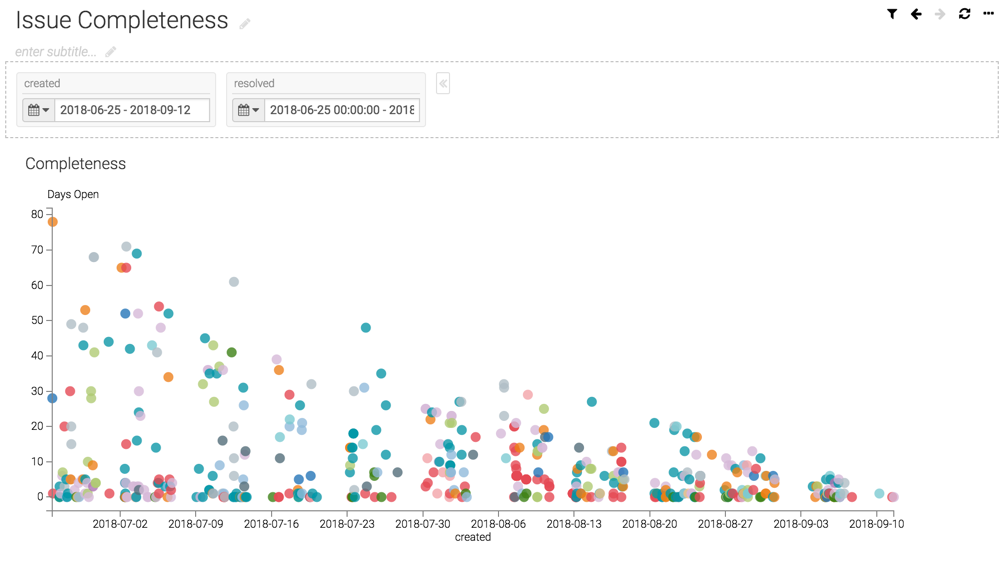
This example shows a dashboard with a Scatter visual that plots created and resolved issues.
In , the quick date filter enables you to provide a quick selection of date ranges for visualizing your data.
This example shows a dashboard with a Scatter visual that plots created and resolved issues.
What kind of feedback do you have?
