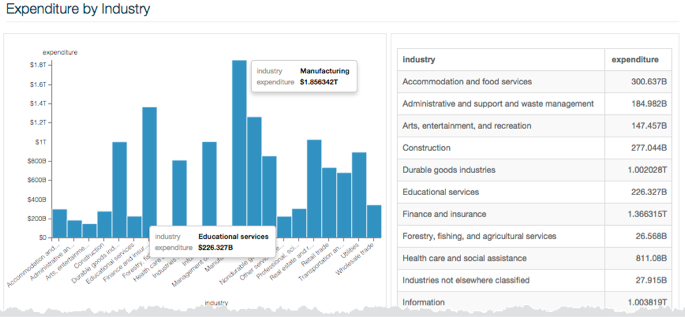
Using custom display formats for large numbers
Currency magnitudes use words, such as thousands (103), millions (106), billions (109), trillions (1012), and so on. In contrast, Scientific Notation uses prefixes: k: kilo- (103), M: Mega- (106), G: Giga- (109), T: Tera- (1012), and so on.
- Click Refresh Visual, and note the display of numbers on the
axis scale and in the tooltips.
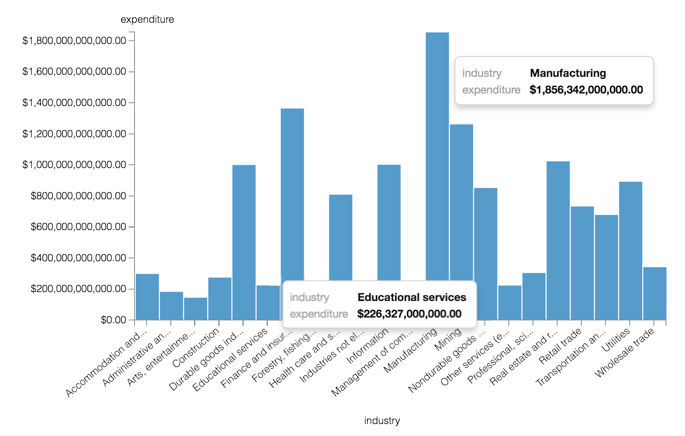
Obviously, the standard currency form is inadequate for representing very large numbers and quickly seeing the difference in their magnitude. If the visual type was a table, it would be much harder still.
- Click Refresh Visual.
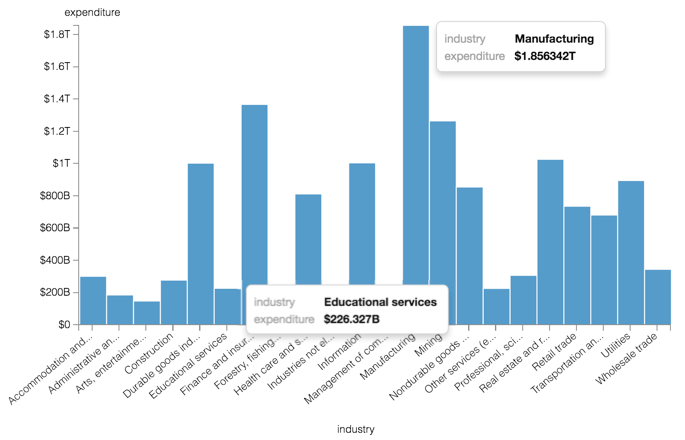
The new display format more clearly categorizes the magnitude of the currency, with Educational Services expenditure valued at approximately $226 Billion, contrasting with Manufacturing at nearly $2 Trillion, for the years covered by the data.
- [Optional] You can see how the data format appears across the data set by creating
a dashboard that contains both this bar chart and a table visual.
Some column values have the suffix B (billions), while larger columns have the suffix T (trillions).